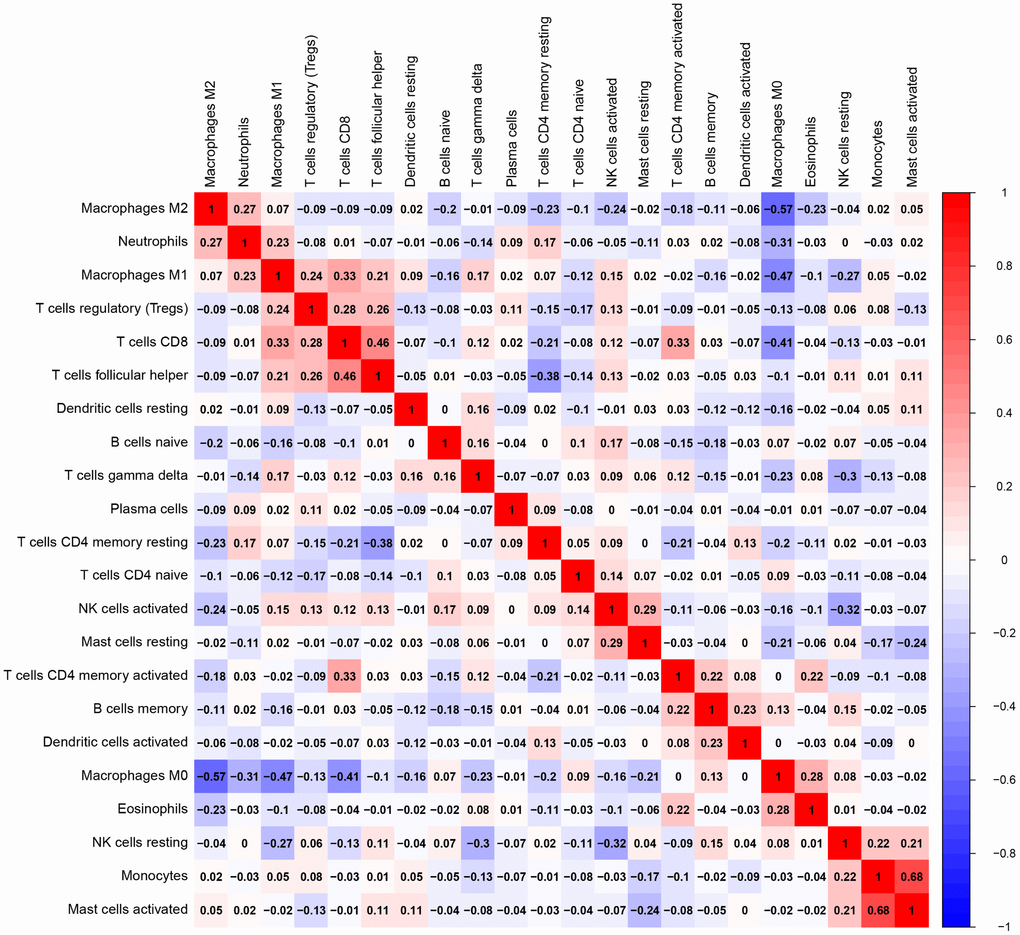
Figure 3.Correlation matrix of all 22 TIICs proportions. Horizontal and vertical axes both represent TIICs. TIICs with higher, lower, and same correlation levels are shown in red, blue, and white, respectively. TIIC, tumor-infiltrating immune cell.
Figure 3 — Profiles of immune cell infiltration and immune-related genes in the tumor microenvironment of osteosarcoma | Aging