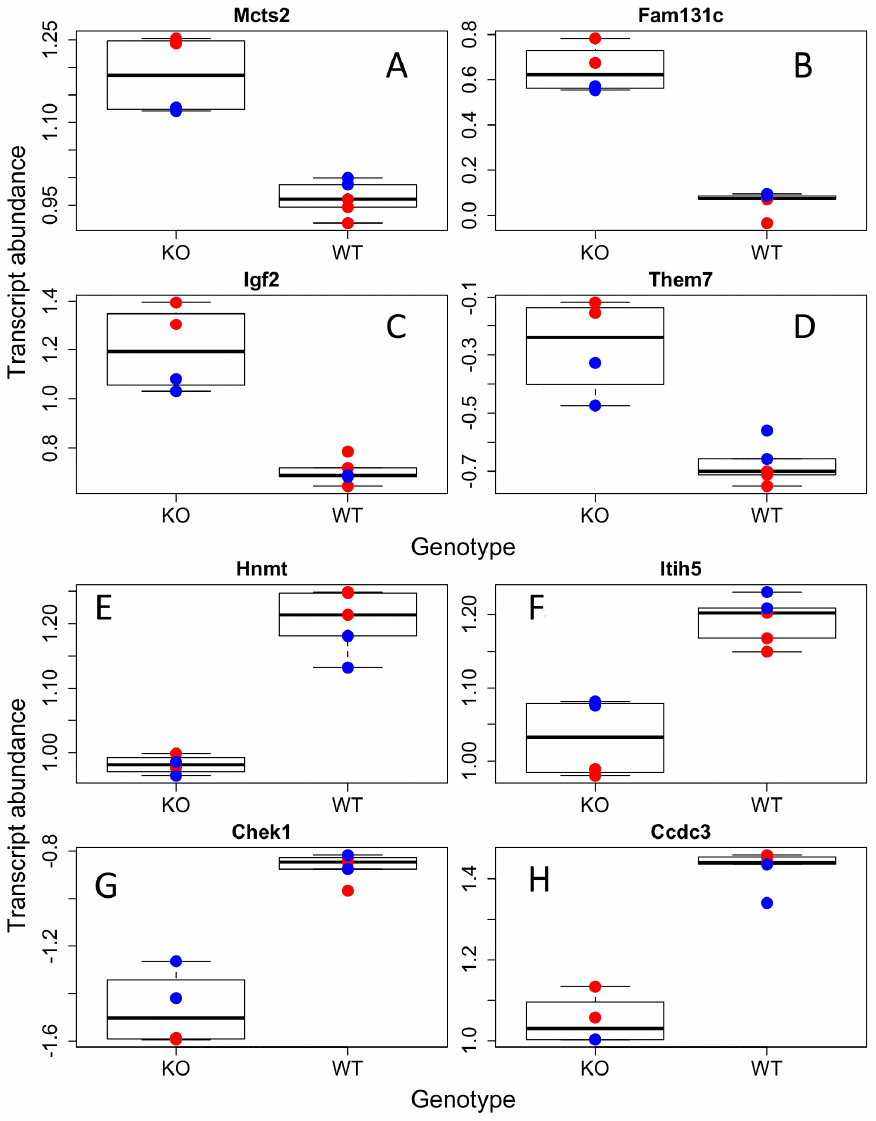
Figure 1.Individual transcripts differentially regulated in GHRH-KO mouse BAT. Sample of transcripts that were significantly increased (A–D) or decreased (E–H) in KO mutants compared to WT. Red dots indicate females, blue-males.
Figure 1 — Transcriptomic and metabolomic profiling of long-lived growth hormone releasing hormone knock-out mice: evidence for altered mitochondrial function and amino acid metabolism | Aging