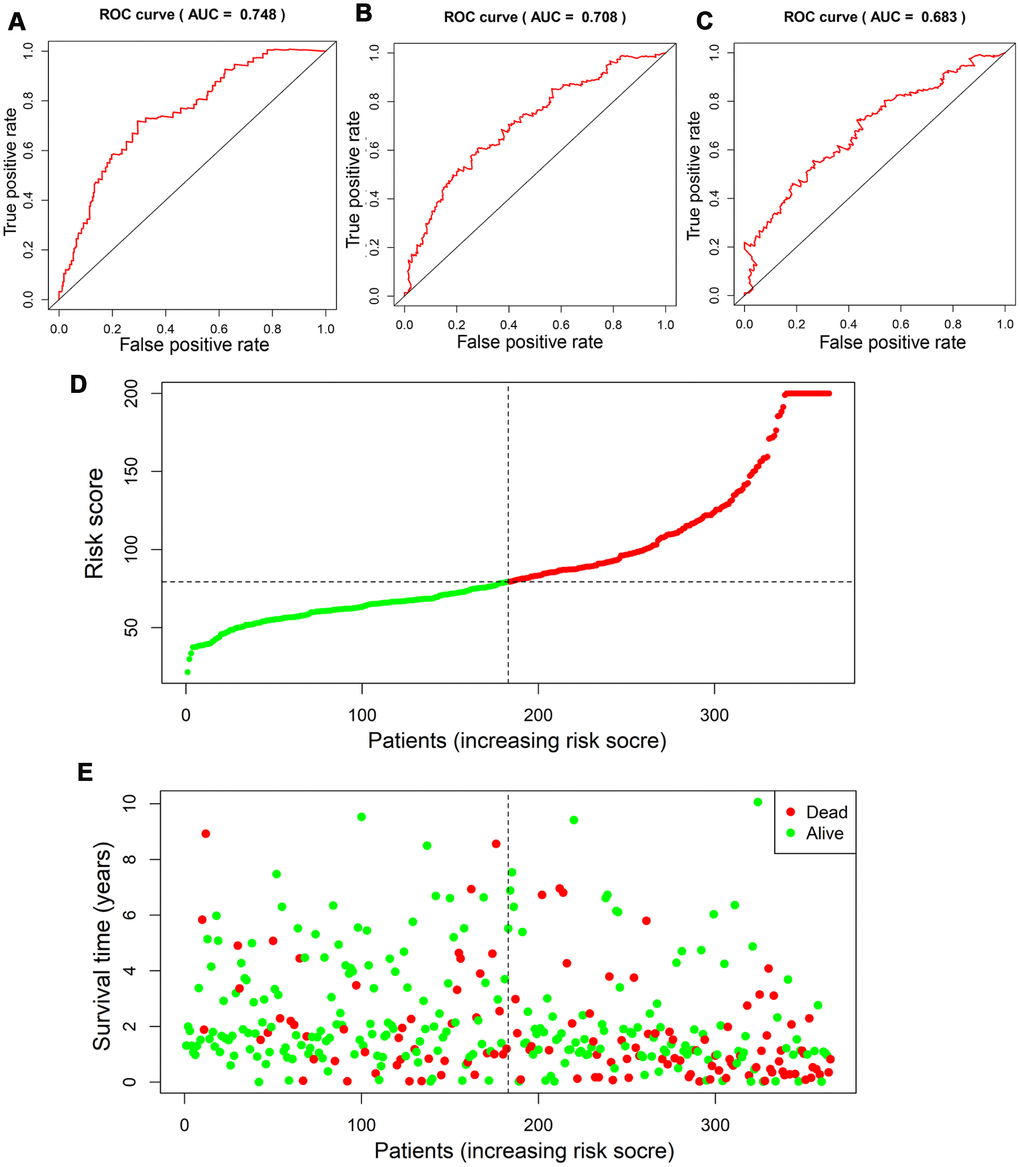
Figure 5.Assessment of prognostic value of risk score in the derivation cohort. Time-dependent ROC analysis showed the diagnostic value of risk score at 1 year, 3 years and 5 years after diagnosis (A–C). Scatter plots showed that different risk scores indicated different survival outcomes in patients with HCC (D, E).