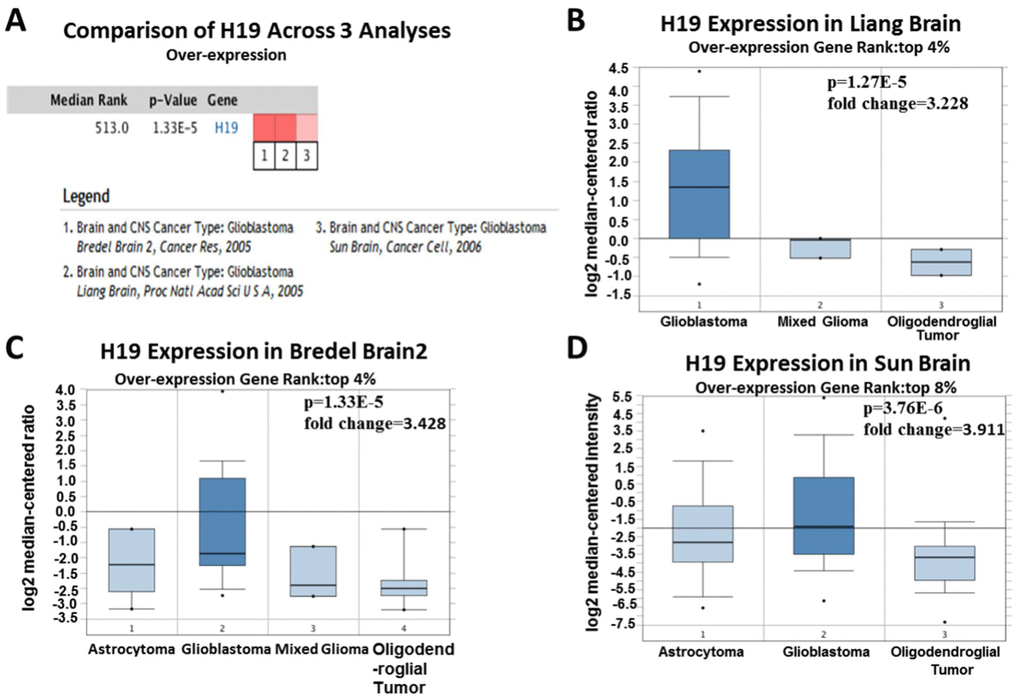
Figure 4.Analysis of relationship between the H19 expression and the malignant degree of glioma. (A) Comparison of H19 expression across three analyses, and red means high expression. H19 expression in (B) Liang Brain, (C) Bredel Brain 2, and (D) Sun Brain. The expression level is evaluated via the median line; Top 4% / (8%) refers to the top 4%/ (8%) of genes; P<0.01.