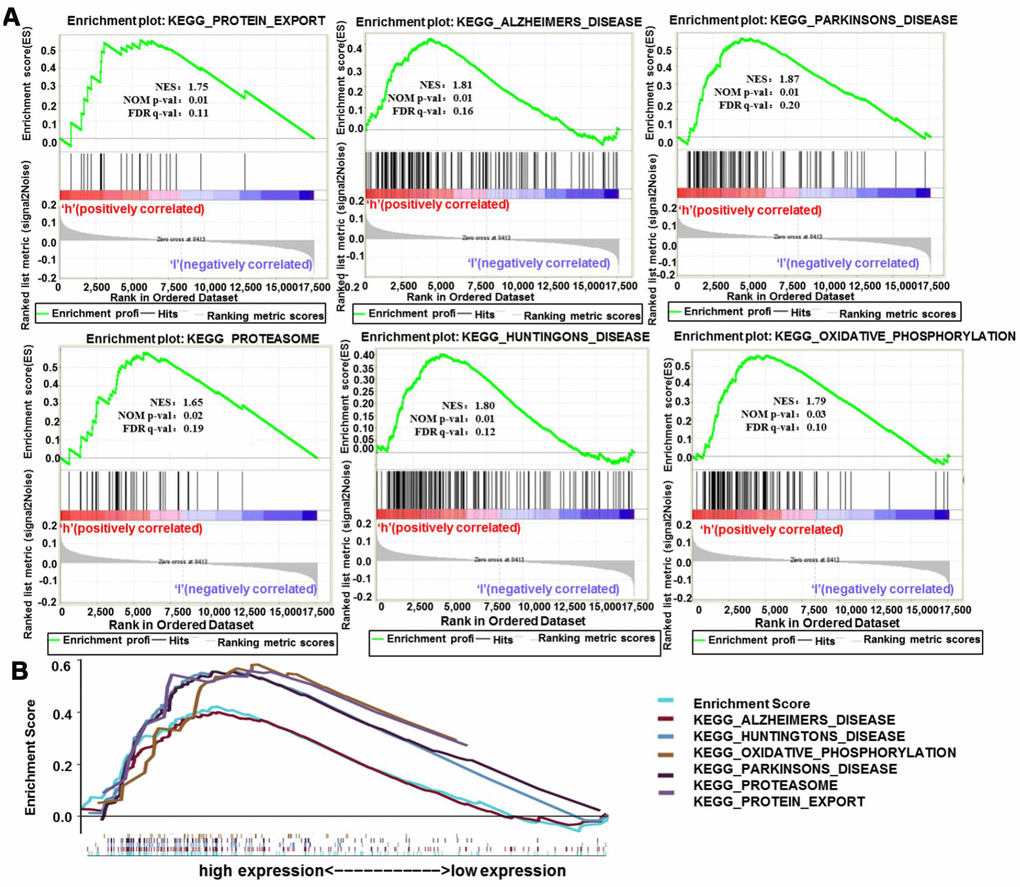
Figure 13.Enrichment plots from GSEA analysis. (A) GSEA analysis showed that protein export, Alzheimer's disease, Parkinson's disease, proteasome, Huntington's disease and oxidative phosphorylation were differentially enriched in H19 high expression phenotype. (B) The integrated GSEA analysis. Abbreviations: GSEA, gene set enrichment analysis; ES, enrichment score; NES, normalized ES; NOM p-val, normalized p-value.