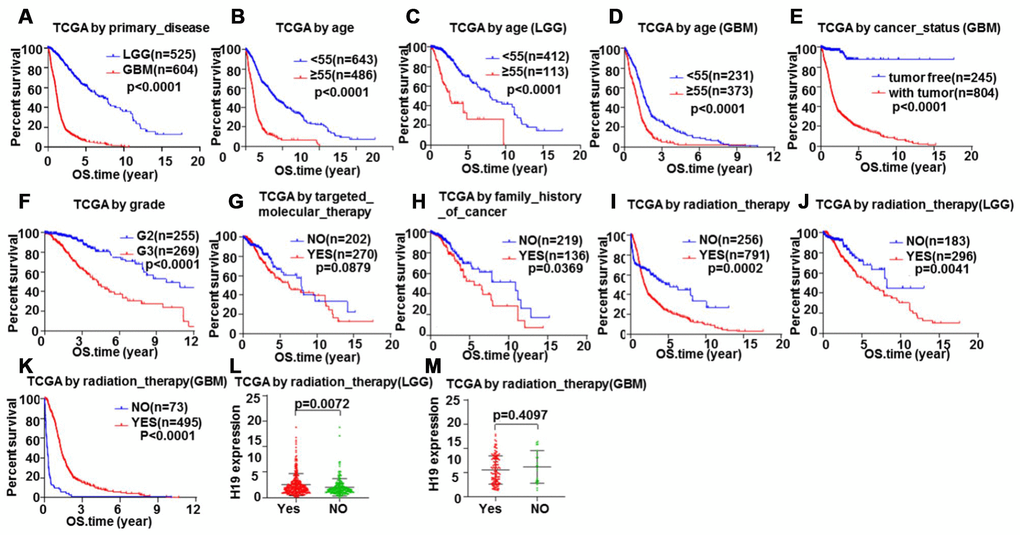
Figure 12.Glioma samples survival analysis validation by Kaplan-Meier. Correlation between total survival and (A) Primary disease, (B–D) Age, (E) Cancer status, (F) Grade, (G) Targeted molecular therapy, (H) Family history of cancer, (I–K) Radiation therapy. The relationship between H19 expression level and radiotherapy in (L) LGG and (M) GBM.