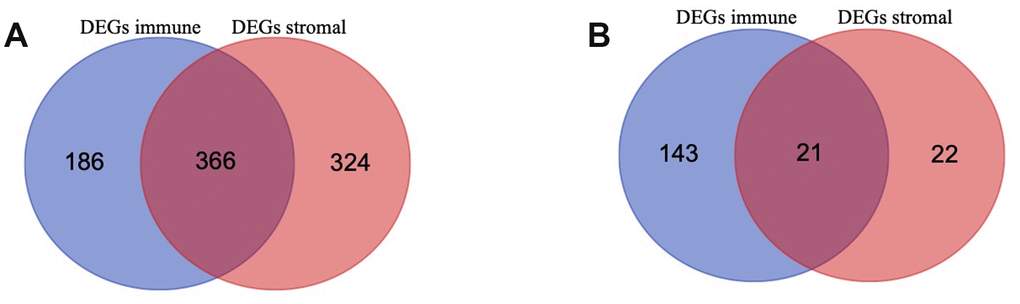
Figure 3.Differentially Expressed Genes (DEGs) selected (A, B) Venn diagram of differentially expressed genes (DEGs) base on immune and stromal score. (A) shows the commonly upregulated DEGs and (B) shows the commonly downregulated DEGs.
Figure 3 — Identification of prognostic immune-related genes in the tumor microenvironment of endometrial cancer | Aging