Submit an Article
Navigate
Home
Editorial Board
Editorial Policies
Current Volume
Archive
Scientific Integrity
Publication Ethics Statements
Interviews with Outstanding Authors
Newsroom
Sponsored Conferences
Podcast
Contact
Special Collections
Submit an Article
Online ISSN: 1945-4589
Research Paper
|
Volume 12, Issue 4
|
pp. 3354–3370
Cancer stem cell-specific expression profiles reveal emerging bladder cancer biomarkers and identify circRNA_103809 as an important regulator in bladder cancer
Back to article
Figure 4
(4 of 11)
−
100%
+
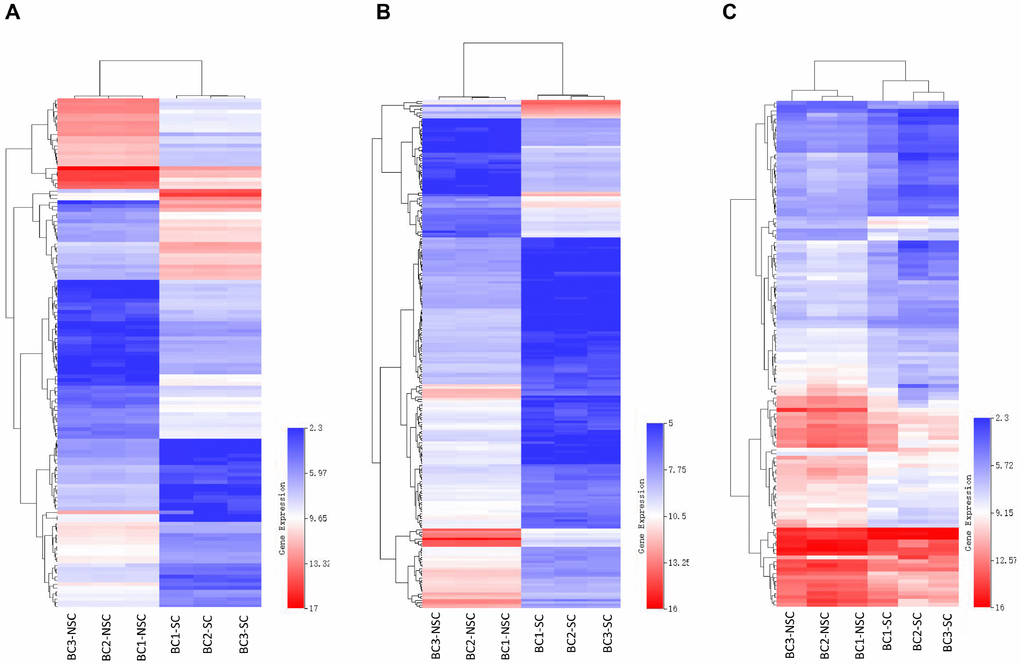
Figure 4.
Heatmap of differentially expressed mRNAs (
A
), lncRNAs (
B
) and circRNAs (
C
) were represented. Red through blue color indicates high to low expression level. Each row indicates one transcript, and each column represents one sample.