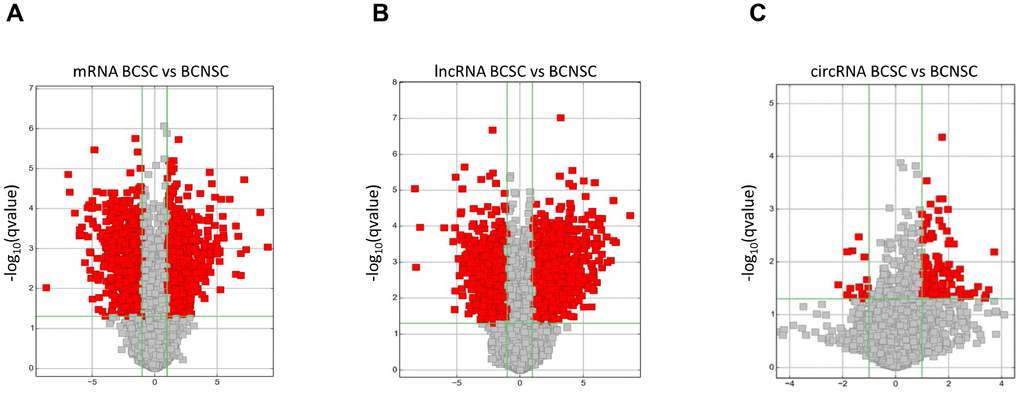
Figure 3.Differentially expressed mRNAs (A), lncRNAs (B) and circRNAs (C) between BCSCs and BCNSCs were analyzed. Volcano plot of the p-values as a function of fold change for mRNAs, lncRNAs and circRNAs indicate the differentially expressed genes between the BCSCs and BCNSCs. Grey dots represent RNAs not significantly differentially expressed (P-value > 0.05) and the red dots represent RNAs differentially expressed (P-value < 0.05).