Submit an Article
Navigate
Home
Editorial Board
Editorial Policies
Current Volume
Archive
Scientific Integrity
Publication Ethics Statements
Interviews with Outstanding Authors
Newsroom
Sponsored Conferences
Podcast
Contact
Special Collections
Submit an Article
Online ISSN: 1945-4589
Research Paper
|
Volume 12, Issue 4
|
pp. 3354–3370
Cancer stem cell-specific expression profiles reveal emerging bladder cancer biomarkers and identify circRNA_103809 as an important regulator in bladder cancer
Back to article
Figure 10
(10 of 11)
−
100%
+
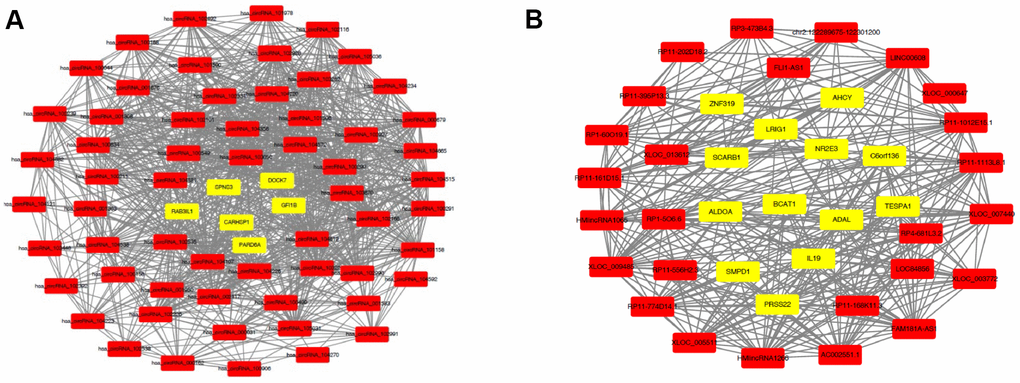
Figure 10.
Coexpression networks constructed by weighted correlation network analysis.
Different colors of dots were used to show different types of genes, with yellow for mRNAs and red for lncRNAs (
A
) or circRNAs (
B
).