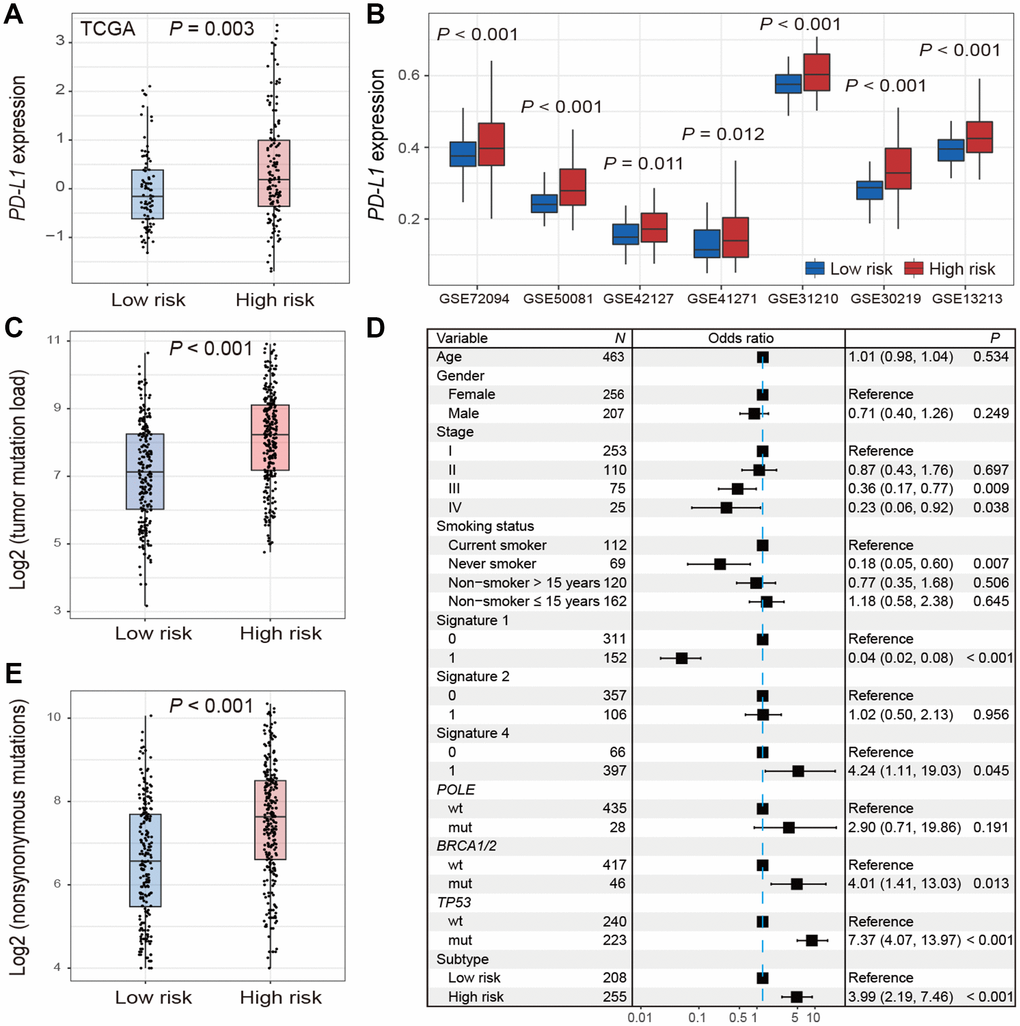
Figure 4.Distribution of PD-L1 expression and tumor mutation burden and their associations with the high-/low-risk subtypes of LUAD. (A, B) Difference in the PD-L1 expression in TCGA and validation cohorts stratified by high-/low-risk subtypes of LUAD. (C–E) Distribution and association of mutation burden in the high-risk group versus low-risk group.