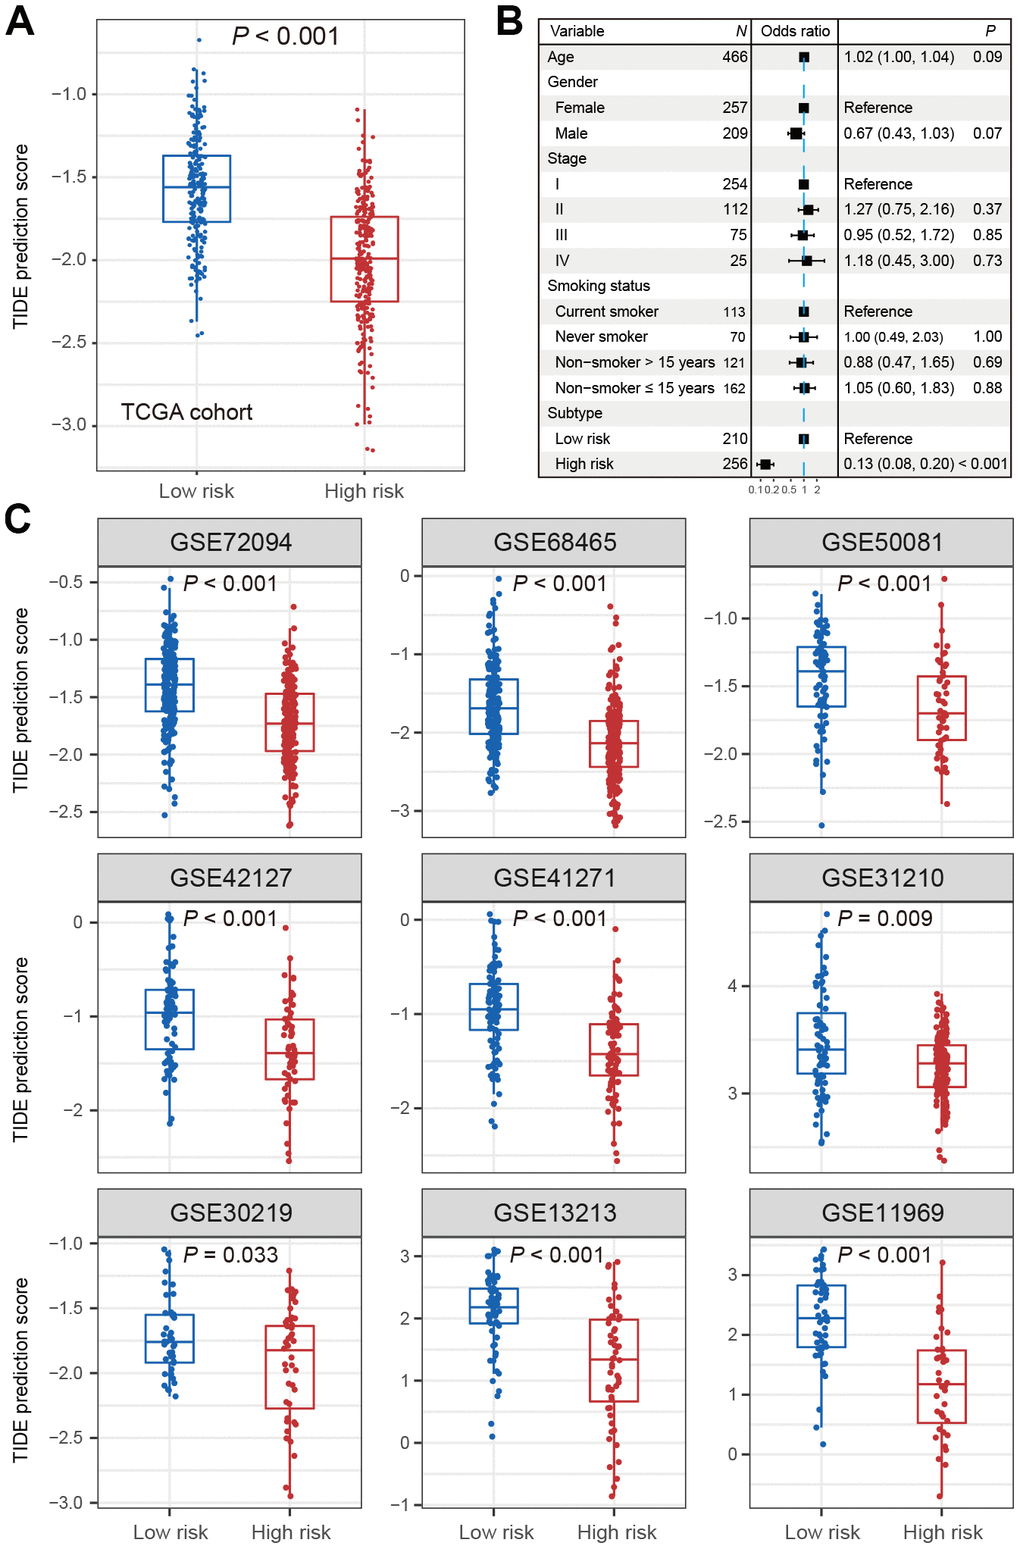
Figure 3.Distribution of TIDE scores in high-risk subtype of LUAD versus low-risk subtype of LUAD. (A) Boxplot representation of TIDE scores in the high-risk group versus low-risk group in TCGA LUAD cohort. (B) Forest plot representation of multivariate model with adjustment for confounding factors in TCGA cohort. (C) Distribution of TIDE scores in 9 independent validation cohorts.