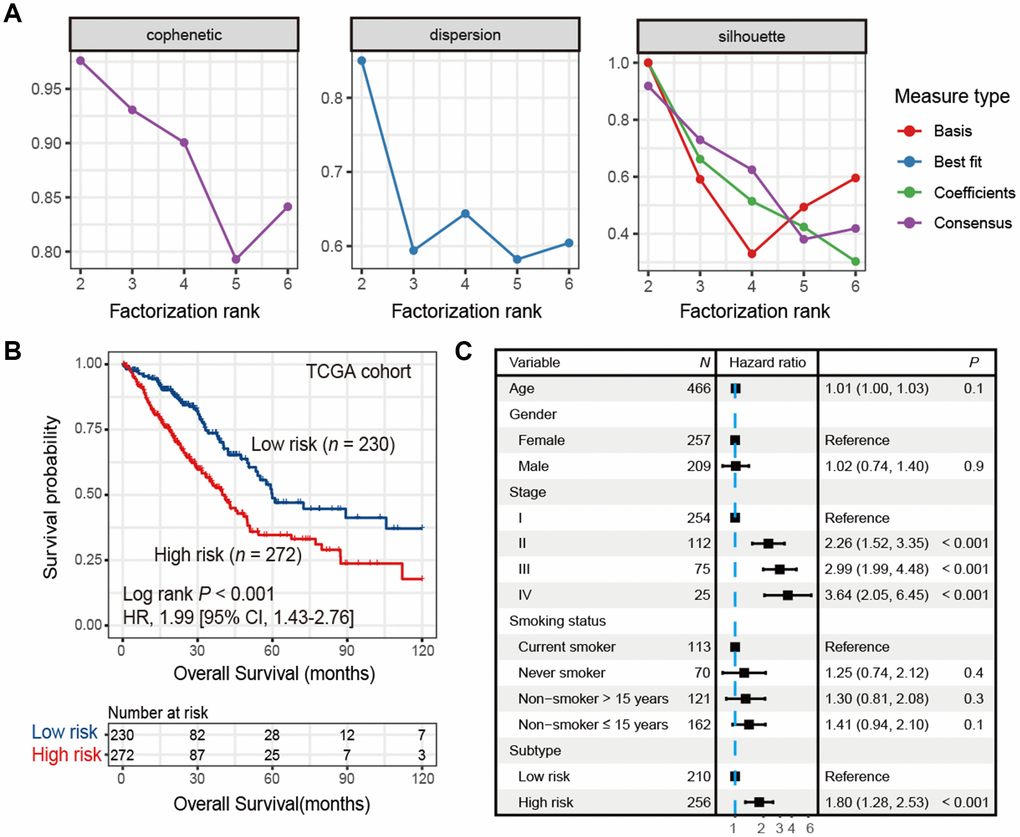
Figure 1.Identification of high-risk and low-risk subtypes of LUAD in TCGA cohort by consensus clustering. (A) The relationship between cophenetic, dispersion and silhouette coefficients with respect to number of clusters. (B) Kaplan-Meier survival plot of the high-risk versus the low-risk subtype. (C) Forest plot representation of multivariate Cox model depicted association between overall survival and LUAD subtypes with other clinical factors taken into account.