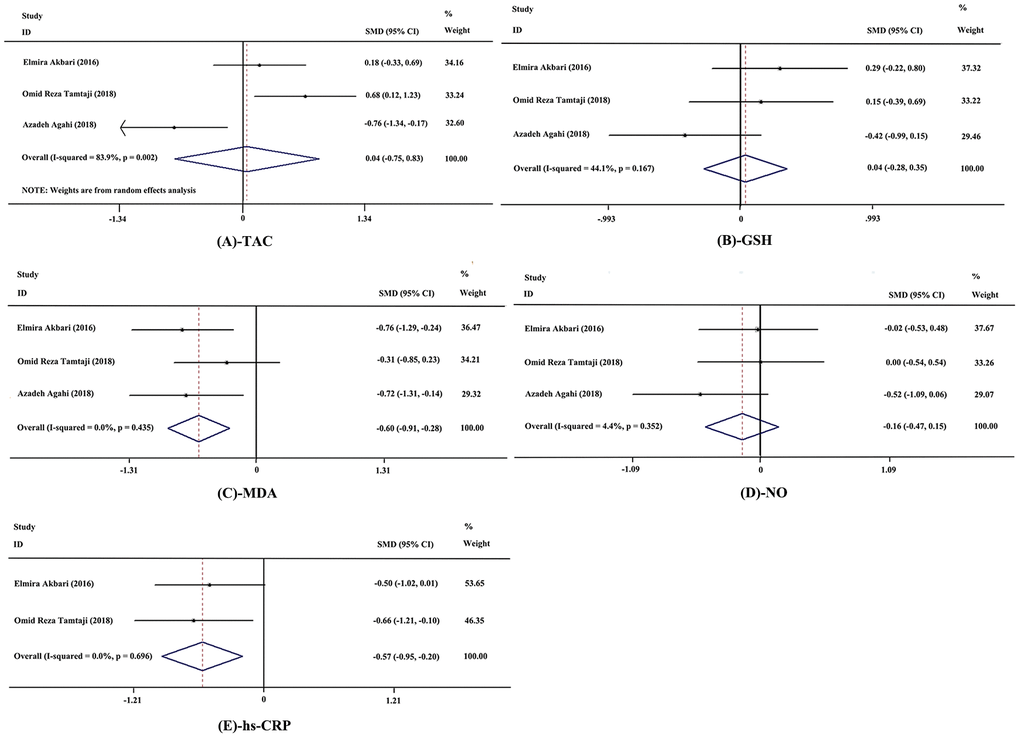
Figure 4.Forest plot showing the effects in the probiotics group versus the control group on biomarkers of inflammation and oxidative stress. (A) Meta-analysis of the effects of probiotics on total anti-oxidant capacity (TAC). (B) Meta-analysis of the effects of probiotics on total glutathione (GSH). (C) Meta-analysis of the effects of probiotics on malondialdehyde (MDA). (D) Meta-analysis of the effects of probiotics on nitric oxide (NO). (E) Meta-analysis of the effects of probiotics on high-sensitivity C-reactive protein (hs-CRP). Weights were assigned according to the number of subjects and SD using STATA 12. A random-effects model was applied to the meta-analysis of TAC, while other biomarkers used a fixed-effects model. The sizes of data markers represent the weight of each study, and the diamonds indicate the overall estimated effect. SMD, standardized mean difference.