Submit an Article
Navigate
Home
Editorial Board
Editorial Policies
Current Volume
Archive
Scientific Integrity
Publication Ethics Statements
Interviews with Outstanding Authors
Newsroom
Sponsored Conferences
Podcast
Contact
Special Collections
Submit an Article
Online ISSN: 1945-4589
Research Paper
|
Volume 12, Issue 3
|
pp. 2939–2951
Atorvastatin reduces cerebral vasospasm and infarction after aneurysmal subarachnoid hemorrhage in elderly Chinese adults
Back to article
Figure 3
(3 of 6)
−
100%
+
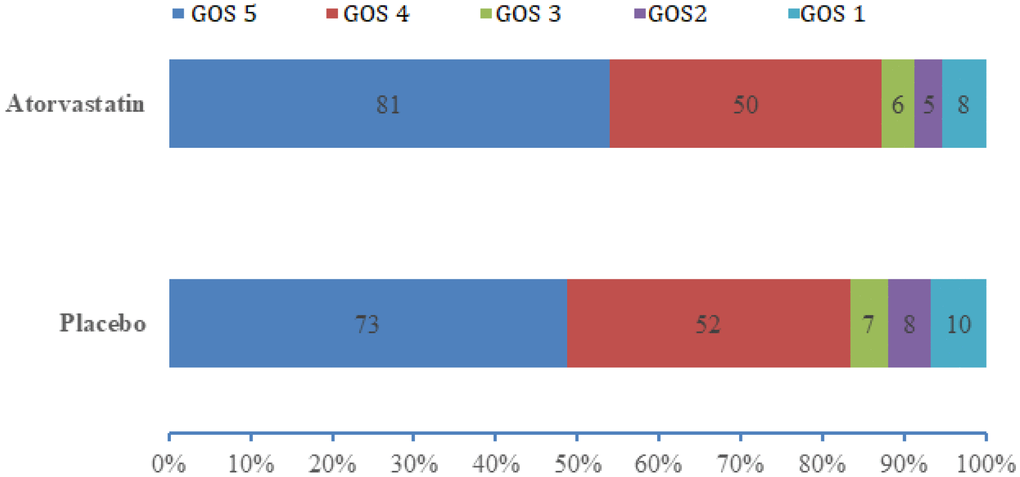
Figure 3.
Distributions of GOS score in the atorvastatin and placebo groups.
Data are number of patients with each GOS score. Tested with Mann-Whitney U test;
P
=0.393.