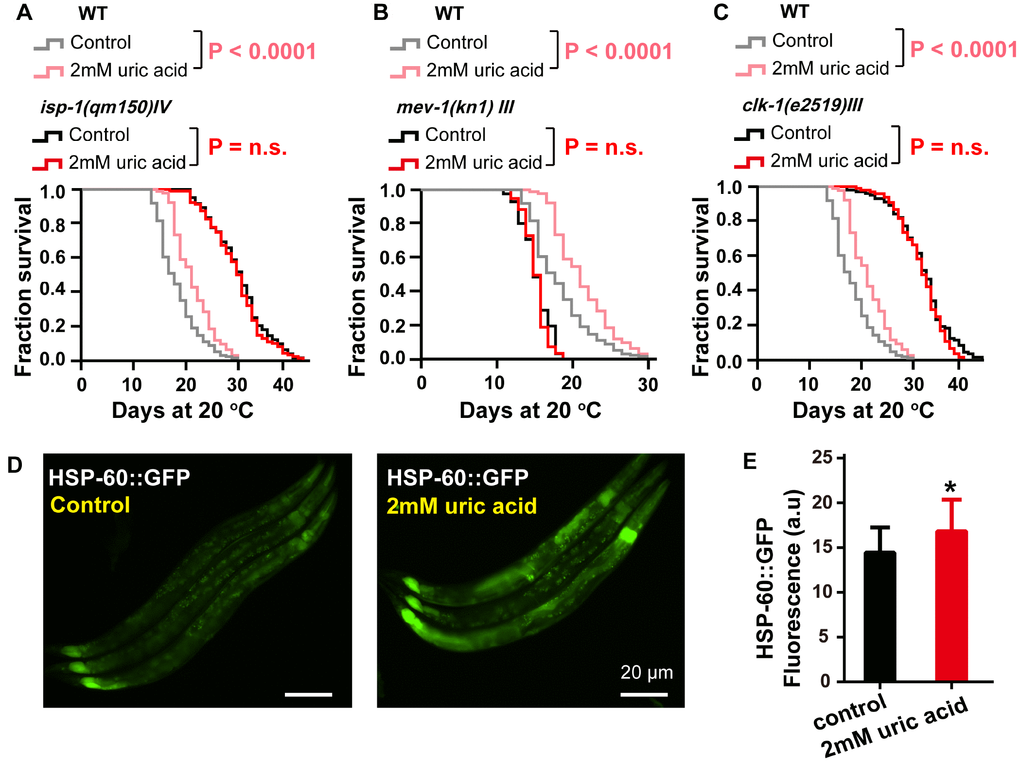
Figure 6.The effect of uric acid on extending life span depends on mitochondrial function. Survival analysis of (A) isp-1 (qm150), (B) mev-1 (kn1), (C) clk-1 (e2519) mutant animals treated with 2 mM uric acid versus control (P value by log-rank test). Details on the life span values are presented in Supplementary Table 1. (D, E) Images and quantification of GFP fluorescence of transgenic strain SJ4058 (hsp-60p::GFP). Data are the means ± SD, n ≥ 30, * p < 0.05 (Student’s t test).