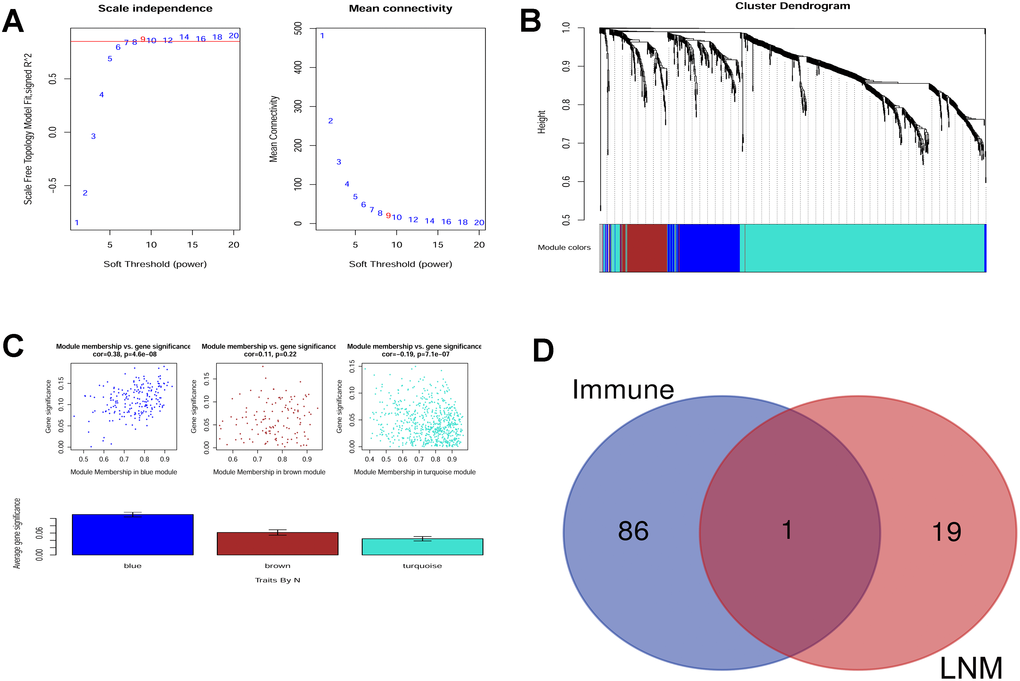
Figure 2.(A) Scale independence and mean connectivity analysis. (B) Gene clustering tree (dendrogram) obtained by hierarchical clustering of adjacency-based dissimilarity. (C) Module-trait relationship plot shows that the blue module has a close correlation with LNM. (D) Venn analysis generated CLDN10 as the key gene that correlates both with LNM and immune.