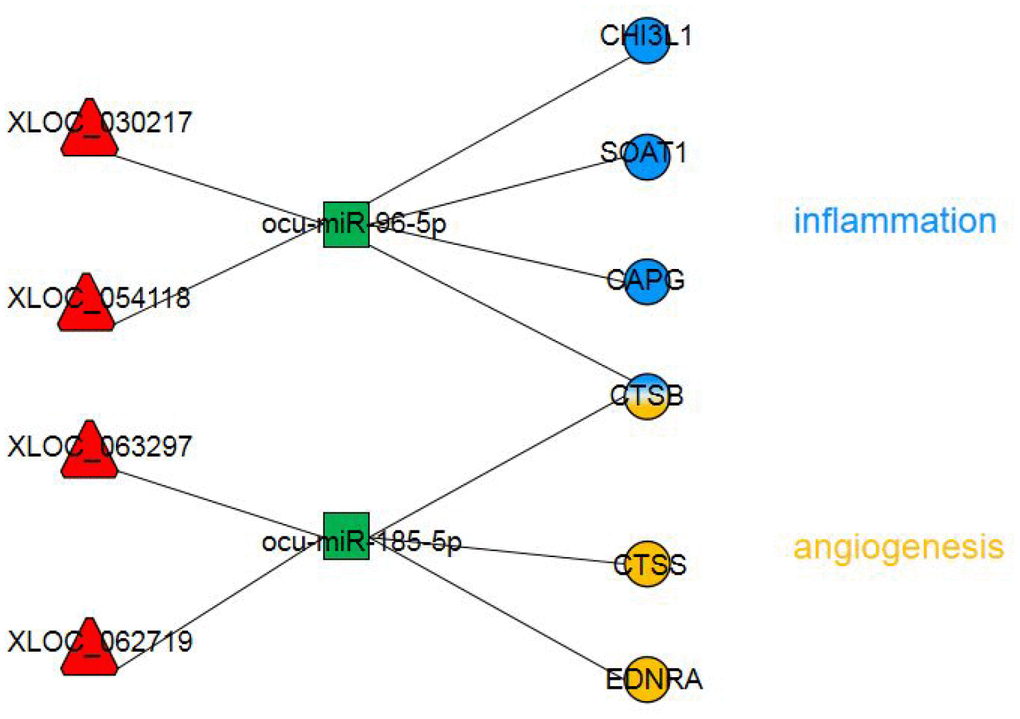
Figure 6.The dysregulated lncRNA-miRNA-mRNA network most likely involved in AS pathogenesis. The circles represent mRNAs with blue indicating inflammation and yellow indicating angiogenesis. The red triangles represent lncRNAs. The green squares represent miRNAs.