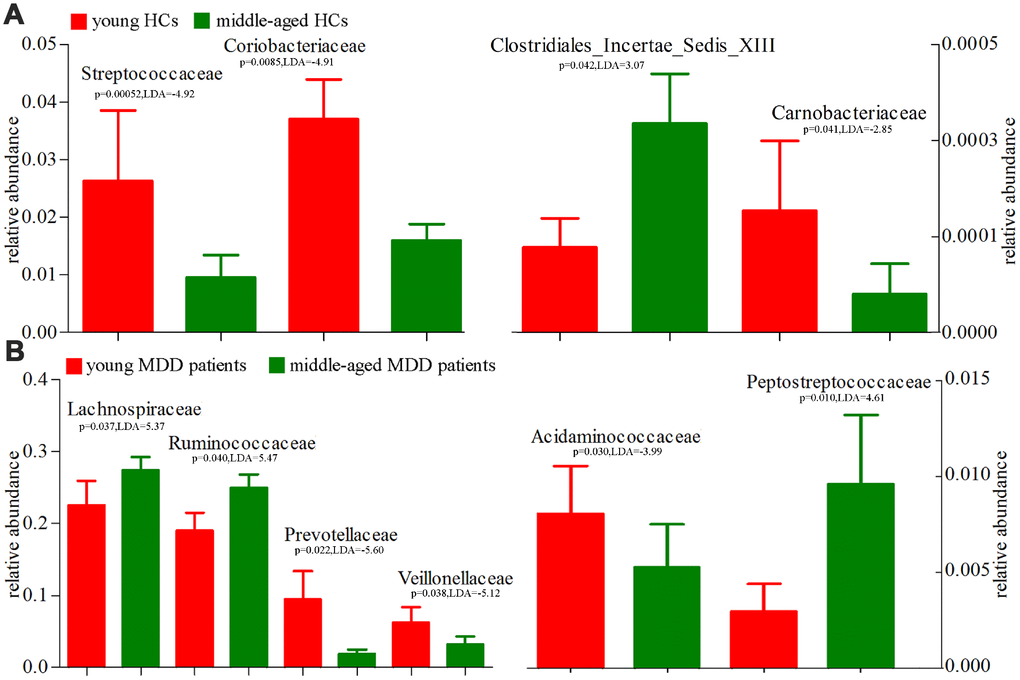
Figure 9.16S rRNA gene sequencing reveals changes to microbial abundances at family level (Mean±SEM). (A) the abundances of four taxonomic levels were significantly changed between young HCs (n=27) and middle-aged HCs (n=44); (B) the abundances of six taxonomic levels were significantly changed between young MDD patients (n=25) and middle-aged MDD patients (n=45).