Submit an Article
Navigate
Home
Editorial Board
Editorial Policies
Current Volume
Archive
Scientific Integrity
Publication Ethics Statements
Interviews with Outstanding Authors
Newsroom
Sponsored Conferences
Podcast
Contact
Special Collections
Submit an Article
Online ISSN: 1945-4589
Research Paper
|
Volume 12, Issue 3
|
pp. 2764–2776
Age-specific differential changes on gut microbiota composition in patients with major depressive disorder
Back to article
Figure 4
(4 of 11)
−
100%
+
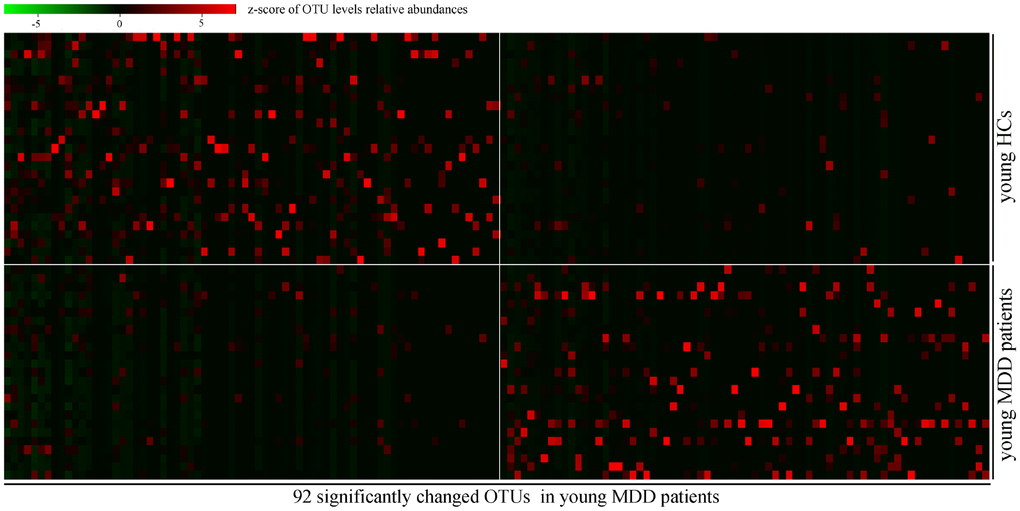
Figure 4.
Heatmap of discriminative OTUs abundances between young HCs (n=27) and young MDD patients (n=25).