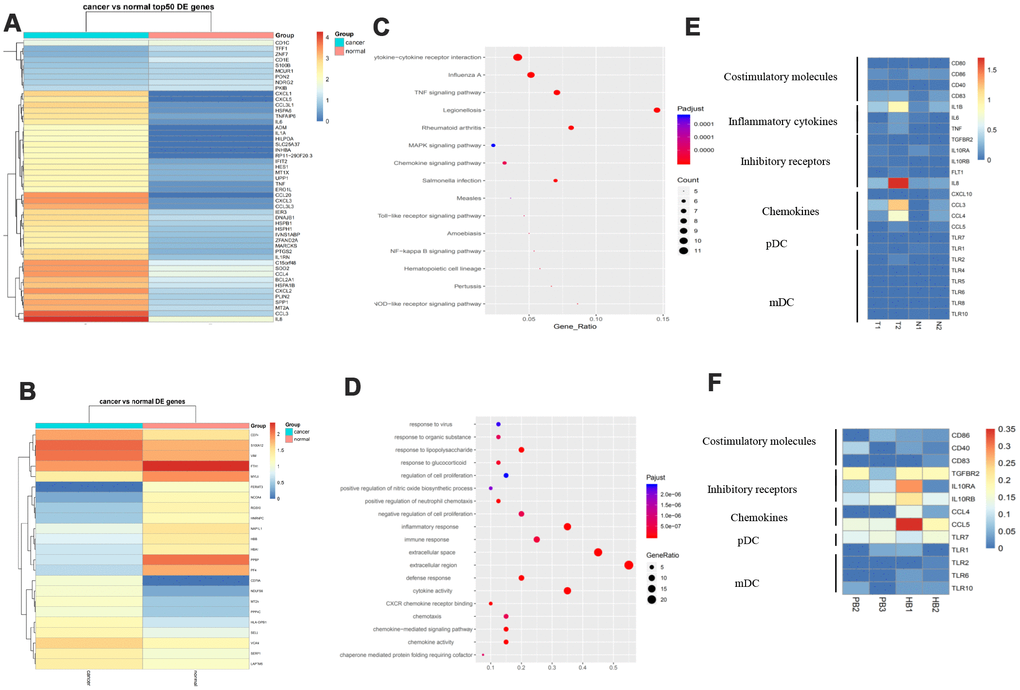
Figure 6.Different DC subtypes and their interactions in GC. (A) Expression analysis of functional molecules in the DC cell cluster in T vs N. (B) Expression analysis of functional molecules in the DC cell cluster in PB vs HB. (C) Pathway analysis of functional molecules in the DC cell cluster in T vs N. (D) Pathway analysis of functional molecules in the DCB cell cluster in PB vs HB. (E) Expression analysis of functional molecules in the DC cell cluster in T vs N. (F) Expression analysis of functional molecules in the DC cell cluster in PB vs HB.