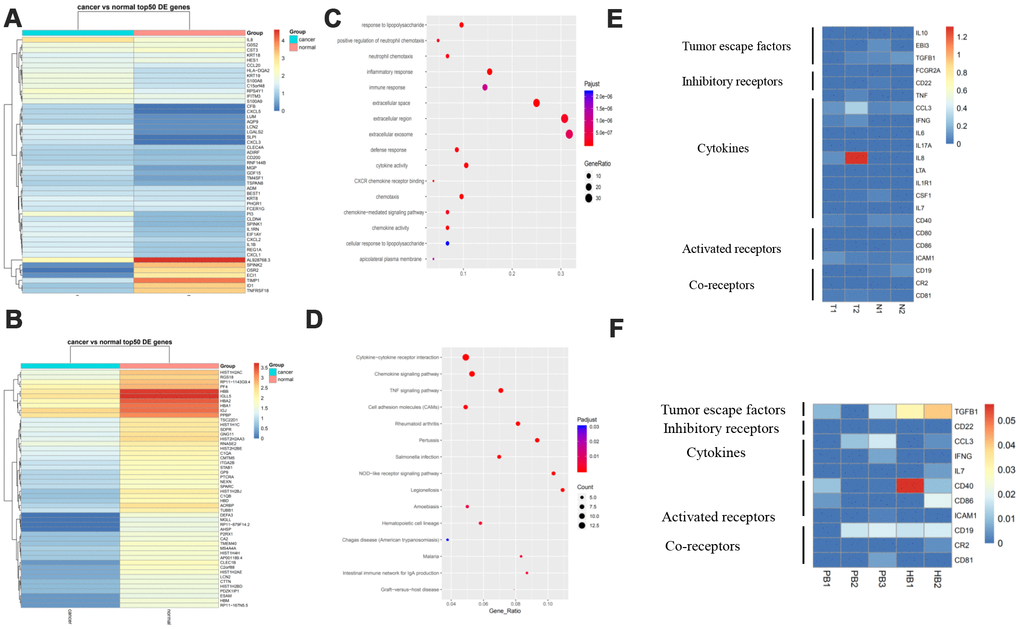
Figure 4.Gene signature of B cells and pathway analysis. (A) The expression analysis of functional molecules in B cell cluster in T vs N. (B) The expression analysis of functional molecules in B cell cluster in PB vs HB. (C) Pathway analysis of in B cell cluster in T vs N. (D) Pathway analysis of in B cell cluster in PB vs HB. (E) The expression analysis of functional molecules in B cell cluster in T vs N. (F) The expression analysis of functional molecules in B cell cluster in PB vs HB.