Submit an Article
Navigate
Home
Editorial Board
Editorial Policies
Current Volume
Archive
Scientific Integrity
Publication Ethics Statements
Interviews with Outstanding Authors
Newsroom
Sponsored Conferences
Podcast
Contact
Special Collections
Submit an Article
Online ISSN: 1945-4589
Research Paper
|
Volume 12, Issue 3
|
pp. 2670–2679
Determinants and indicators of successful ageing associated with mortality: a 4-year population-based study
Back to article
Figure 3
(3 of 3)
−
100%
+
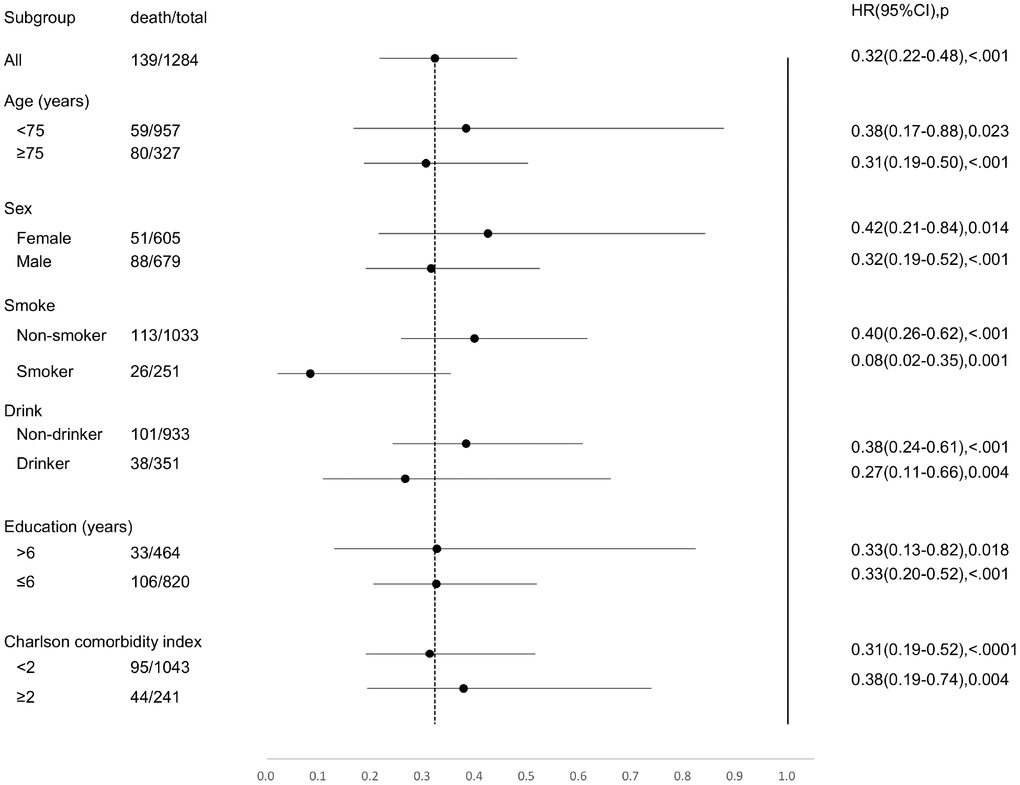
Figure 3.
Forest plot for full adjusted Cox regression analysis of any domains of successful aging against mortality by age, sex, smoking, drinking alcohol, years of education, and Charlson Comorbidity Index.