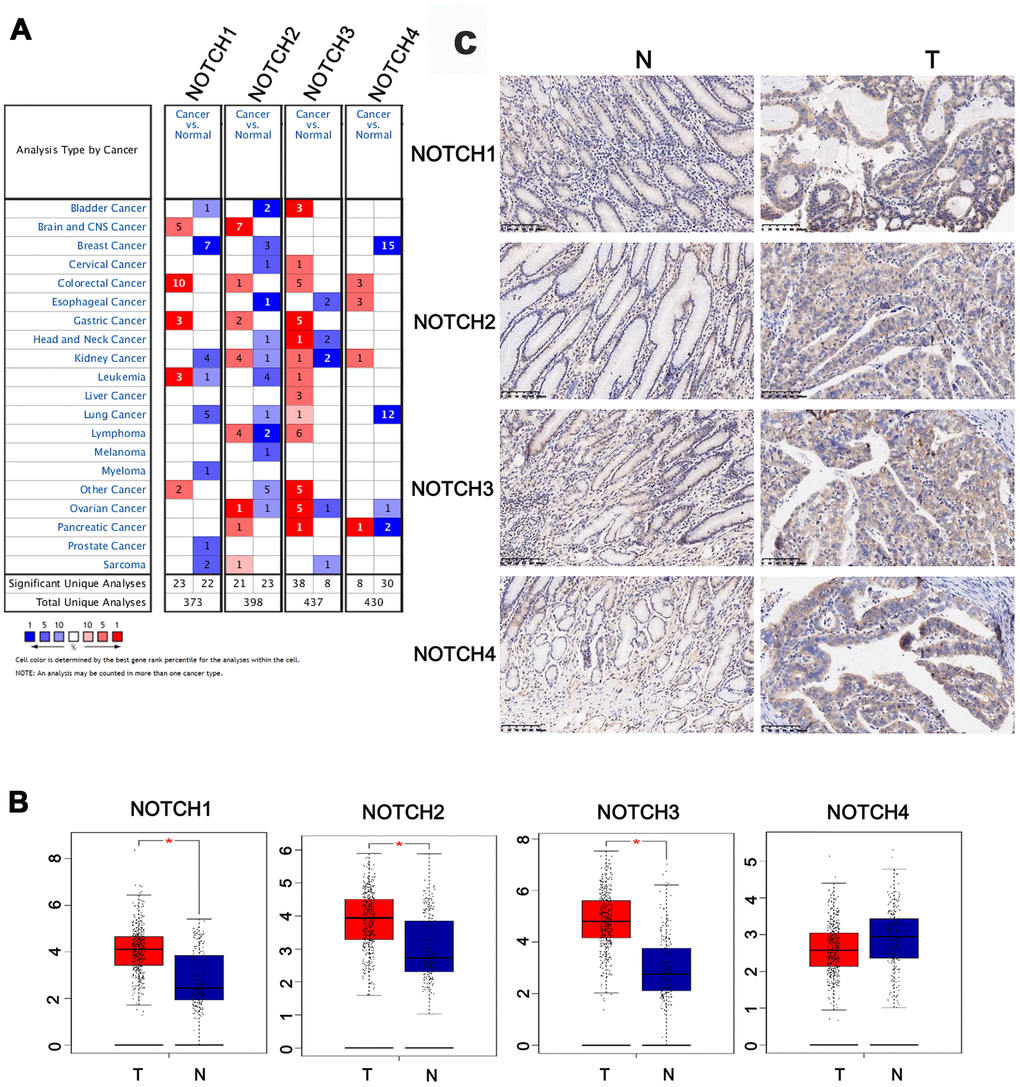
Figure 1.The expression of Notch in different tissues. (A) The transcription levels of Notch receptors in different types of cancers. (B) The expression of Notch receptors in GC. (C) The expression of Notch protein in GC. Students’t-test was used in comparative analysis of Notch expression. T: tumor, N: normal tissue, number (T) = 415, number (N) = 211.