Submit an Article
Navigate
Home
Editorial Board
Editorial Policies
Current Volume
Archive
Scientific Integrity
Publication Ethics Statements
Interviews with Outstanding Authors
Newsroom
Sponsored Conferences
Podcast
Contact
Special Collections
Submit an Article
Online ISSN: 1945-4589
Research Paper
|
Volume 12, Issue 3
|
pp. 2584–2594
LDL-C plays a causal role on T2DM: a Mendelian randomization analysis
Back to article
Figure 2
(2 of 3)
−
100%
+
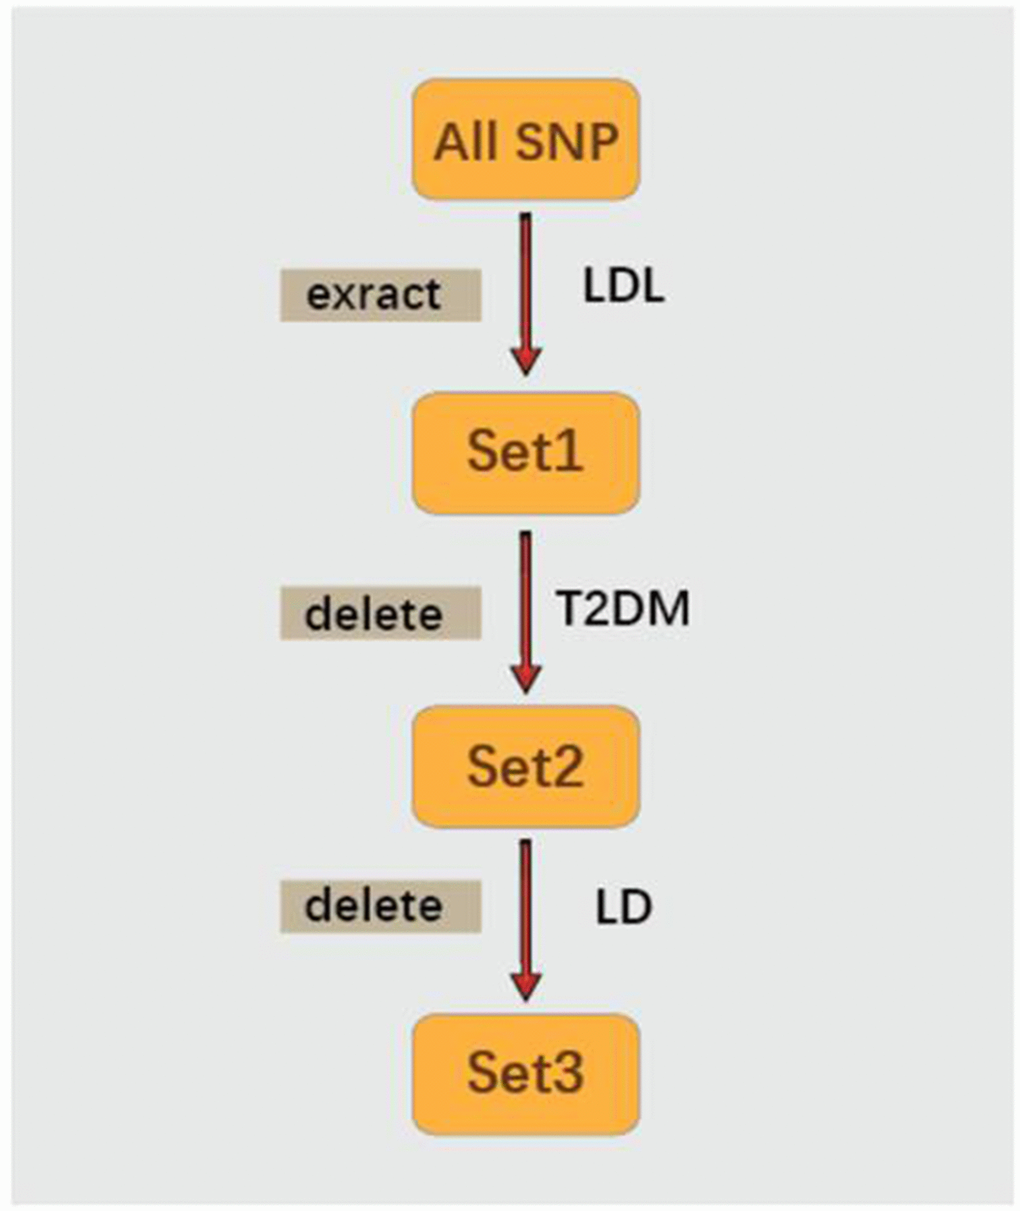
Figure 2.
Forest plot of the ORs and 95%CIs of the instrumental variables.
Figure 2 — LDL-C plays a causal role on T2DM: a Mendelian randomization analysis | Aging