Submit an Article
Navigate
Home
Editorial Board
Editorial Policies
Current Volume
Archive
Scientific Integrity
Publication Ethics Statements
Interviews with Outstanding Authors
Newsroom
Sponsored Conferences
Podcast
Contact
Special Collections
Submit an Article
Online ISSN: 1945-4589
Research Paper
|
Volume 12, Issue 3
|
pp. 2530–2544
Circular RNA expression in isoproterenol hydrochloride-induced cardiac hypertrophy
Back to article
Figure 9
(9 of 10)
−
100%
+
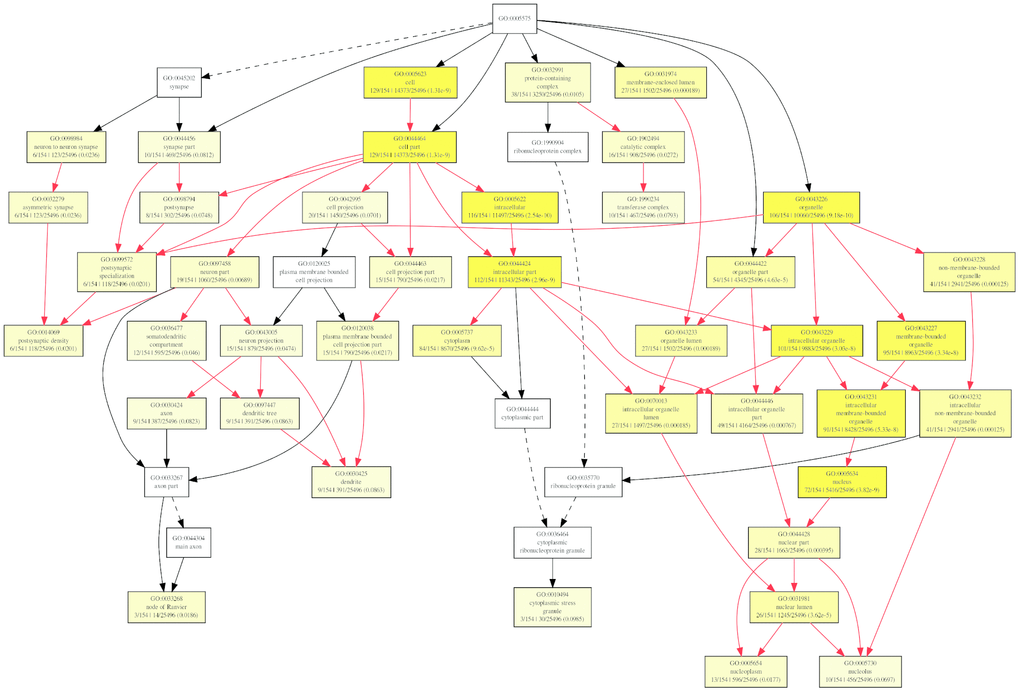
Figure 9.
Diagrams of enriched cellular components category of mRNAs targeted of by miRNAs with GOEAST. The yellower the color, the more significant and the smaller p-value it is.