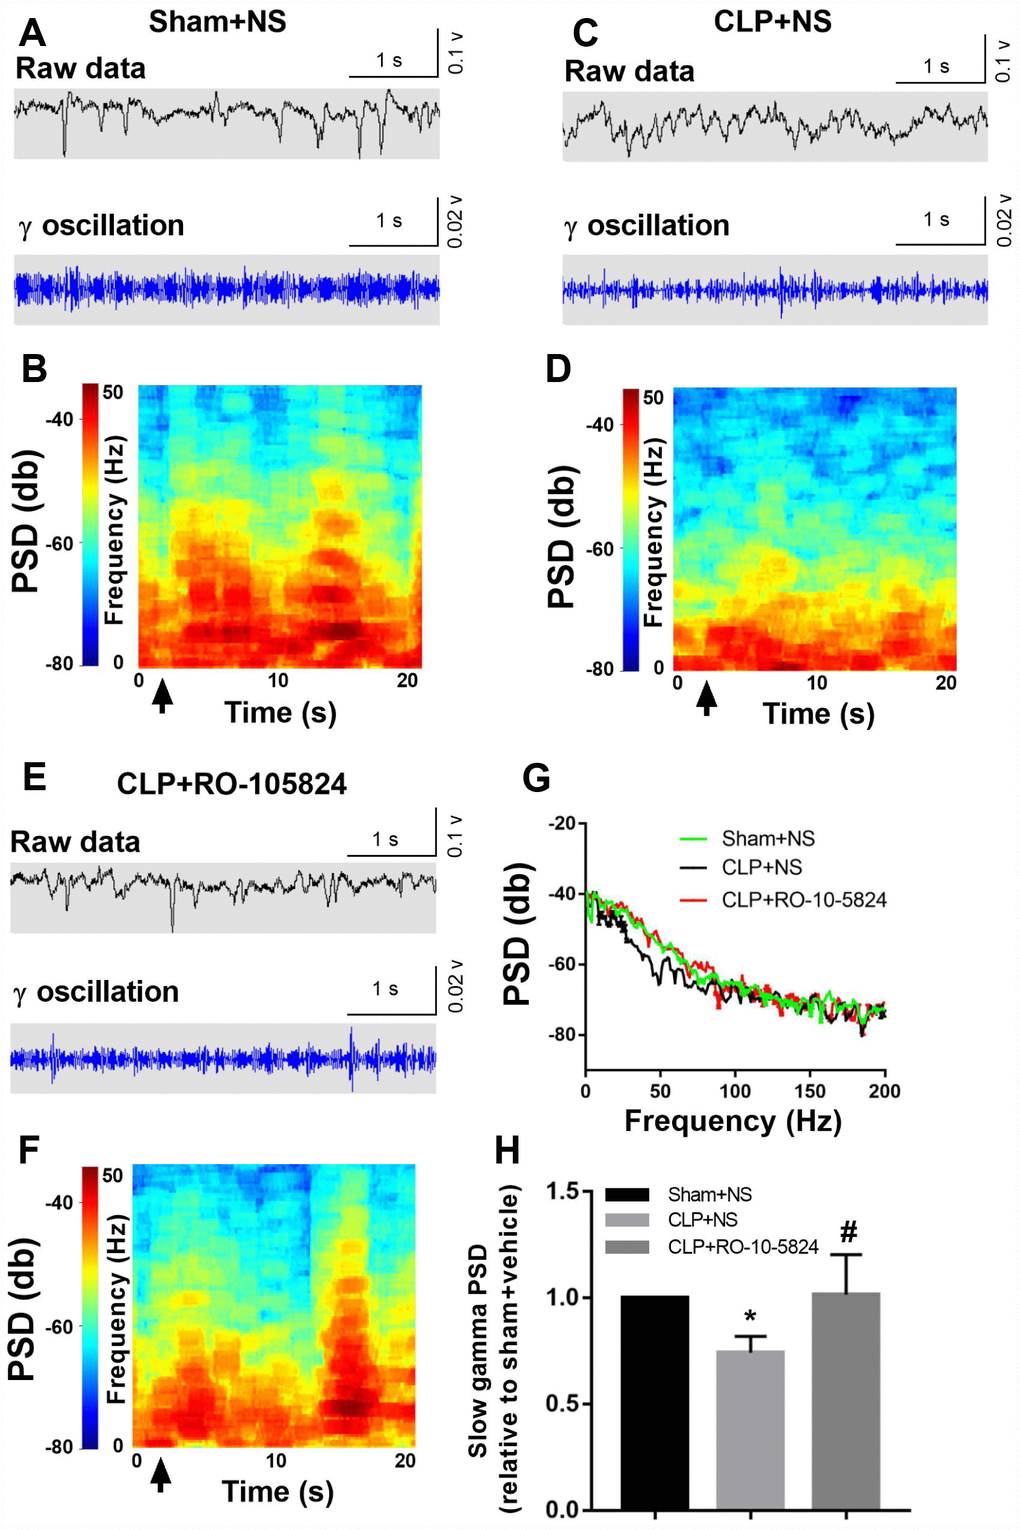
Figure 5.RO-10-5824 treatment reversed CLP-induced decreased slow γ band power. (A–F) Example recordings and example power spectra of γ oscillations in the hippocampal area CA1 of sham, CLP + NS, and CLP + RO-10-5824 groups. (G–H) Summary of LFP power. The slow γ band power was significantly higher in CLP + RO-10-5824 group when compared with CLP + NS group. Data are shown as mean ± SD (n = 5), *P < 0.05 vs sham + NS group, #P < 0.05 vs CLP + NS group. LFP, local field potentials; PSD, power spectral density.