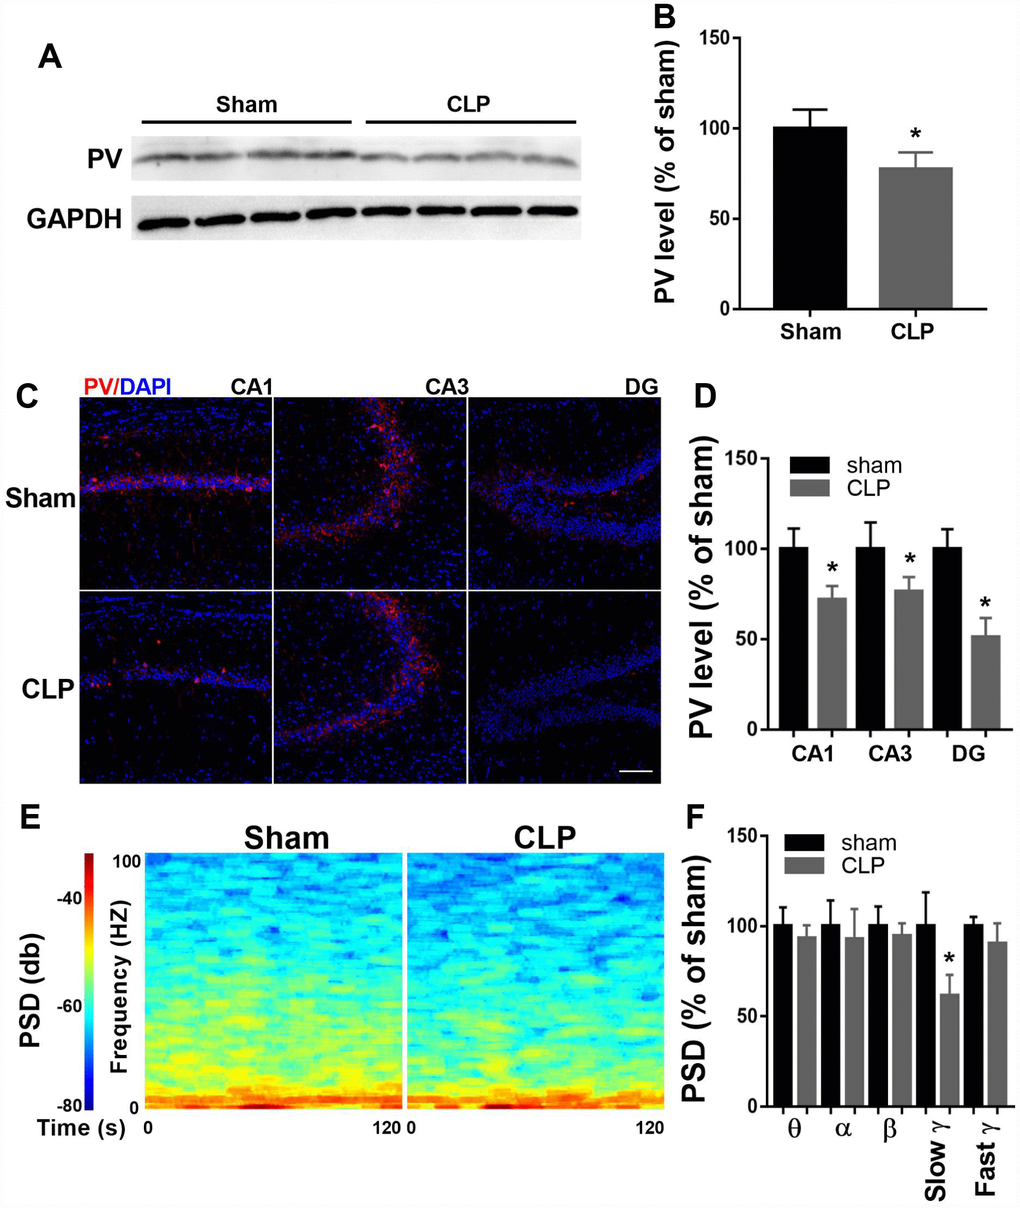
Figure 2.Altered hippocampal PV expression and LFP after CLP. (A–B) PV expression decreased significantly at 14 days after CLP compared with sham group (n = 4). (C–D) Decreased PV expression was observed in all subregions of the hippocampus 14 days after CLP (n = 4). (E–F) Slow γ oscillation band was significantly decreased in CLP group when compared with sham group, but there was no difference in θ, α, β, or fast γ band power between these two groups (n = 3). Data are shown as mean ± SD, *P < 0.05 vs sham group, scale bar = 50 μm.