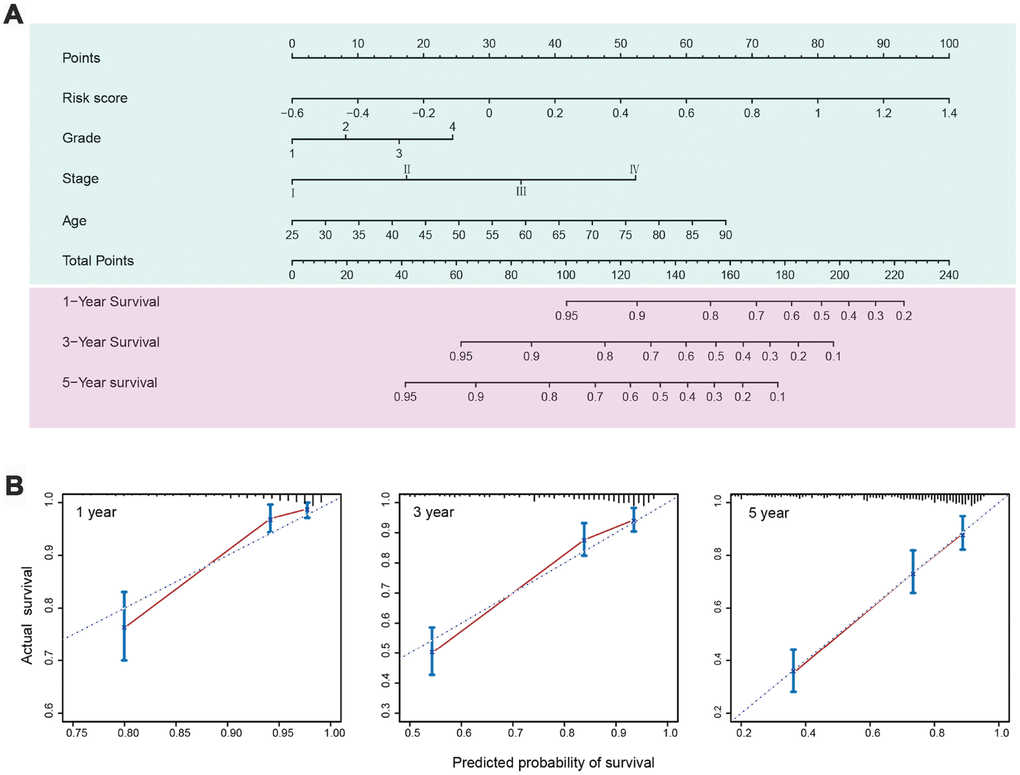
Figure 7.Nomogram and calibration plots for prediction of patients’ survival in the entire TCGA set. (A) Nomogram combining the five-IRG risk signature with clinical factors for prediction of 1-year, 3-year, and 5-year survival rates. (B) Calibration plots showing high predictive accuracy of the nomogram.