Submit an Article
Navigate
Home
Editorial Board
Editorial Policies
Current Volume
Archive
Scientific Integrity
Publication Ethics Statements
Interviews with Outstanding Authors
Newsroom
Sponsored Conferences
Podcast
Contact
Special Collections
Submit an Article
Online ISSN: 1945-4589
Research Paper
|
Volume 12, Issue 3
|
pp. 2302–2332
Identification of an immune-related risk signature for predicting prognosis in clear cell renal cell carcinoma
Back to article
Figure 6
(6 of 7)
−
100%
+
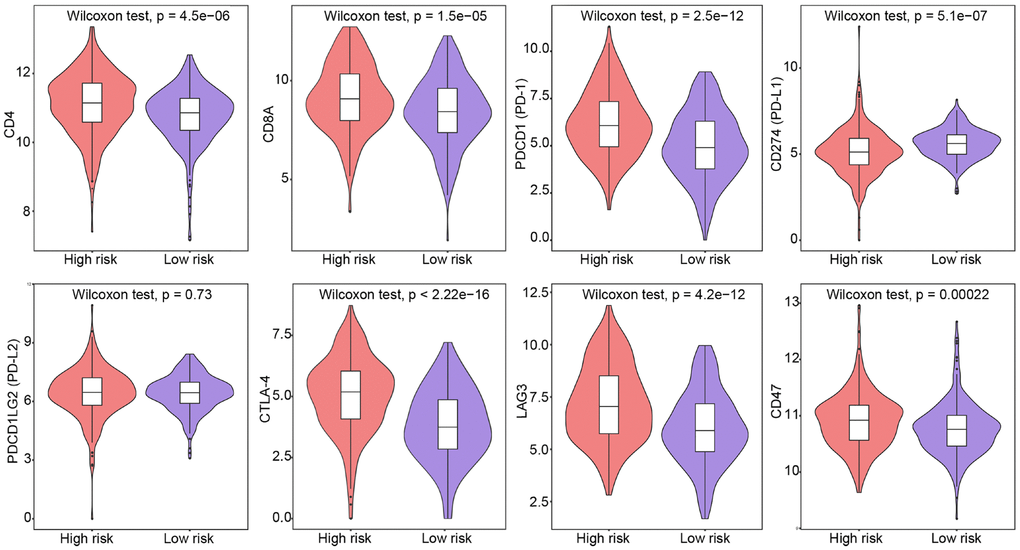
Figure 6.
Expression of T-cell and immune checkpoint markers in low-risk and high-risk patients.
Group differences were assessed by Wilcoxon test.
Figure 6 — Identification of an immune-related risk signature for predicting prognosis in clear cell renal cell carcinoma | Aging