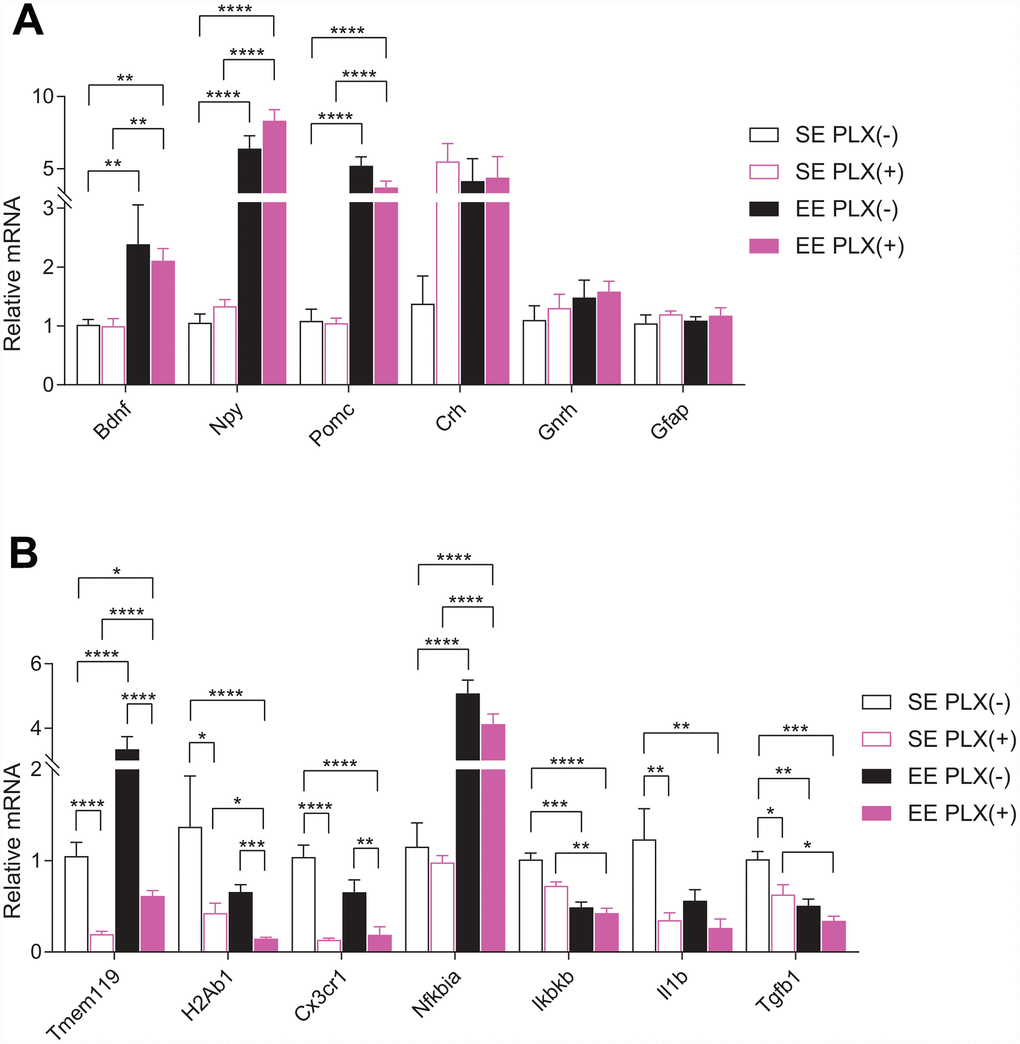
Figure 4.Hypothalamic gene expression. (A) Gene expression for hypothalamic and glia genes. (B) Microglial-associated, inflammatory pathway, and cytokine gene expression. (A–B) n=6 per group. *p<0.05, **p<0.01, ***p<0.001, ****p<0.0001. Values are means ± SEM. Statistical analyses are shown in Supplementary File 1.