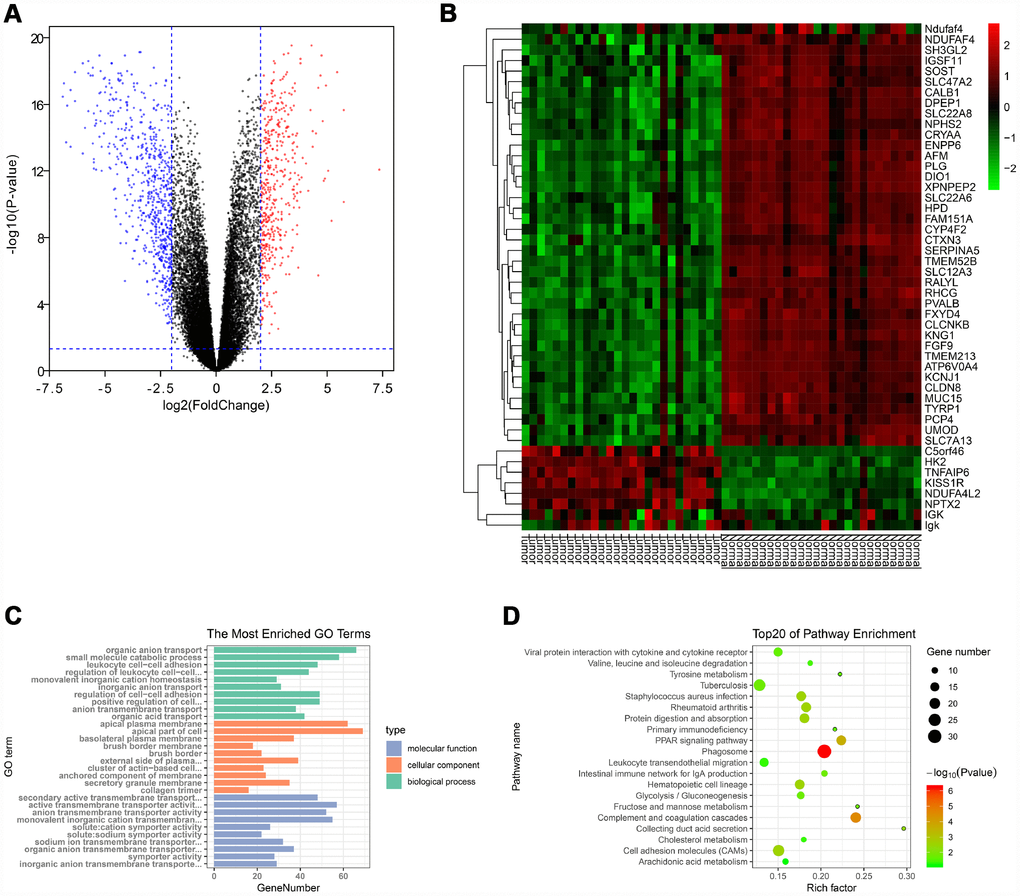
Figure 1.Identification of DEGs and functional annotation. (A) The DEGs were exhibited as a volcano plot. Red dot: up-regulated genes; Blue dot: down-regulated genes; Black dot: unchanged genes. (B) Heatmap of the top 50 genes. (C) GO enrichment analysis of DEGs. Green columns: biological process group; Orange columns: cellular component group; Blue columns: molecular function group. (D) KEGG pathway enrichment analysis of DEGs. Top 20 enriched pathways were exhibited. DEGs: differentially expressed genes; GO: Gene Ontology; KEGG: Kyoto Encyclopedia of Genes and Genomes.