Submit an Article
Navigate
Home
Editorial Board
Editorial Policies
Current Volume
Archive
Scientific Integrity
Publication Ethics Statements
Interviews with Outstanding Authors
Newsroom
Sponsored Conferences
Podcast
Contact
Special Collections
Submit an Article
Online ISSN: 1945-4589
Research Paper
|
Volume 12, Issue 2
|
pp. 1446–1464
Immunological analyses reveal an immune subtype of uveal melanoma with a poor prognosis
Back to article
Figure 4
(4 of 6)
−
100%
+
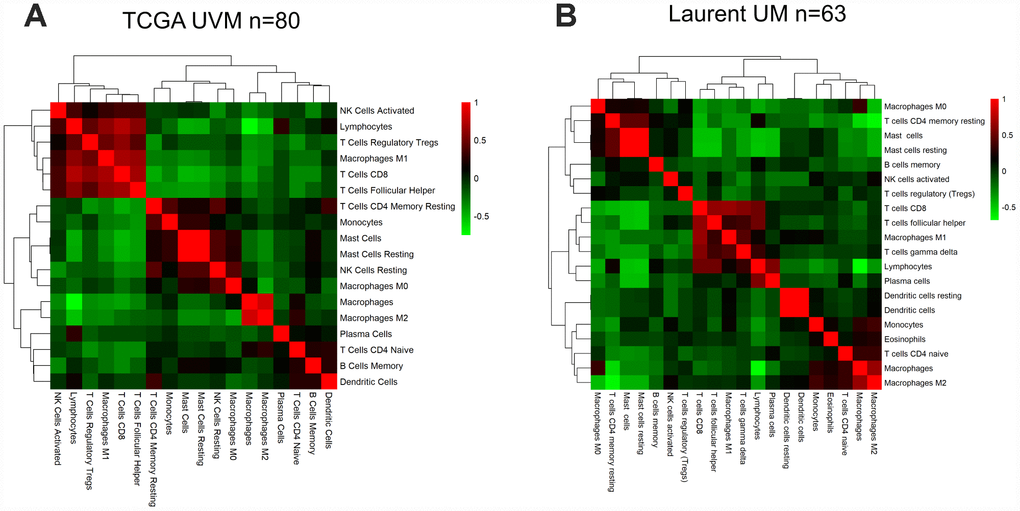
Figure 4.
The correlation between the immune score and immune cell infiltration in UM.
Pairwise correlation heatmap among immune cell-type scores in the datasets from TCGA (
A
) and GSE22138 (
B
).