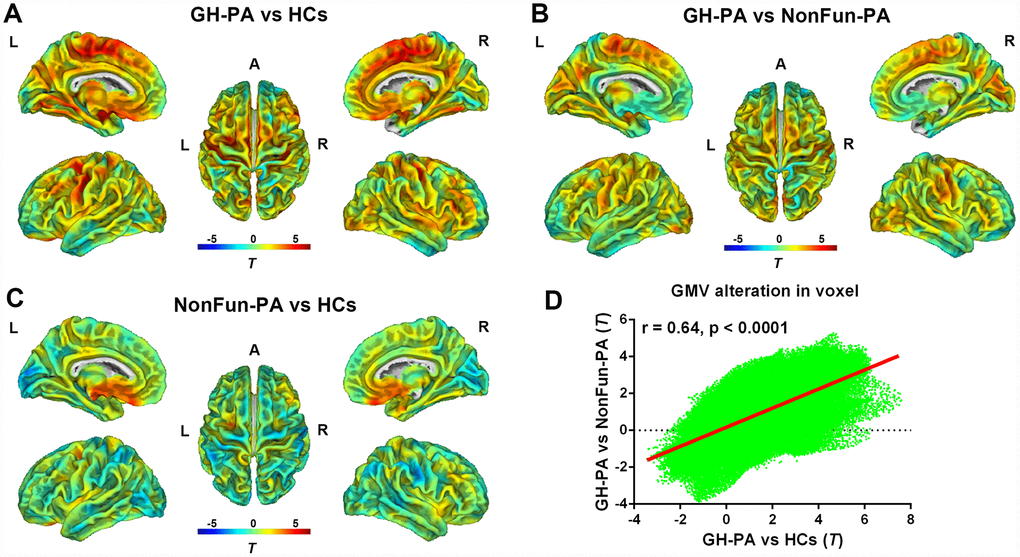
Figure 3.Distribution of GMV alterations in voxel level among the three groups. VBM analysis showing the GMV alteration in GH-PA vs HCs (A), in GH-PA vs NonFun-PA (B), in NonFun-PA vs HCs (C). Correlation analysis of GMV alteration pattern between GH-PA vs HCs and GH-PA vs NonFun-PA (D).