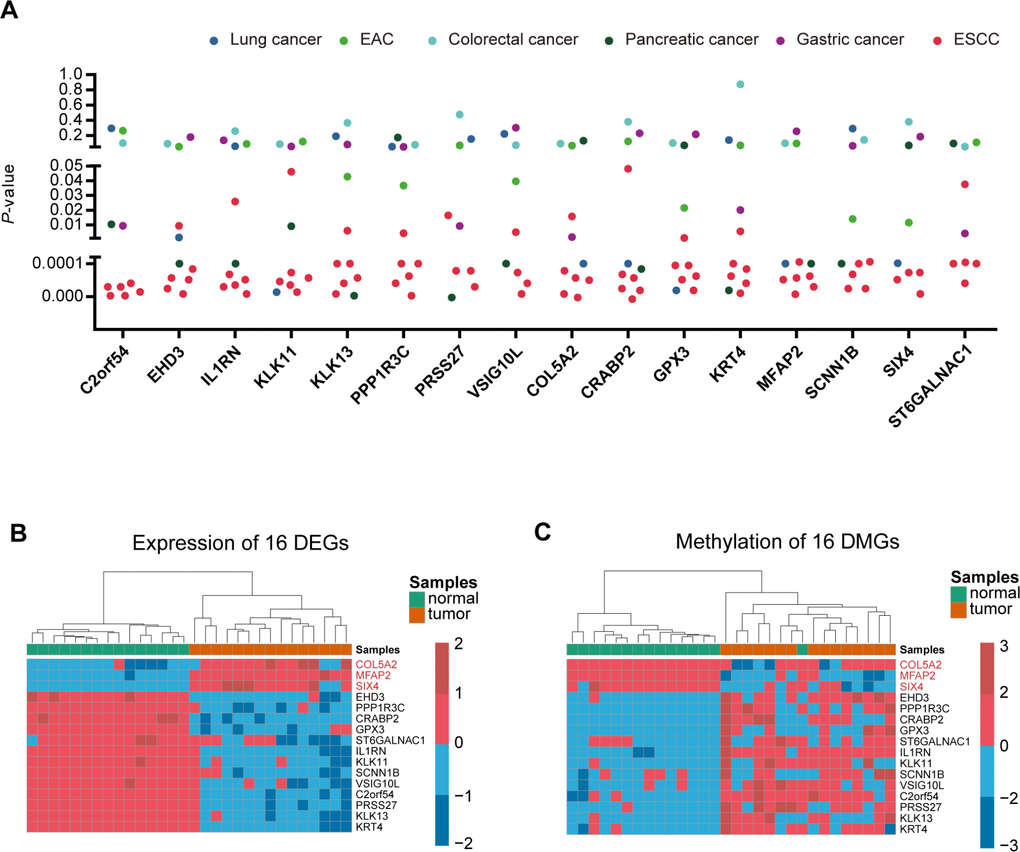
Figure 2.Identification of ESCC-specific genes. (A), Genes were filtered from ten data sets (5 ESCC data sets and five other cancer data sets) to obtain specific key genes in ESCC. Scatter plot shows the p-value of 16 differentially-expressed genes in the ten data sets. (B, C) Heatmap of methylation and expression of the 16 key genes, respectively.