Submit an Article
Navigate
Home
Editorial Board
Editorial Policies
Current Volume
Archive
Scientific Integrity
Publication Ethics Statements
Interviews with Outstanding Authors
Newsroom
Sponsored Conferences
Podcast
Contact
Special Collections
Submit an Article
Online ISSN: 1945-4589
Research Paper
|
Volume 12, Issue 2
|
pp. 1213–1236
MicroRNA-200a induces immunosuppression by promoting PTEN-mediated PD-L1 upregulation in osteosarcoma
Back to article
Figure 8
(8 of 8)
−
100%
+
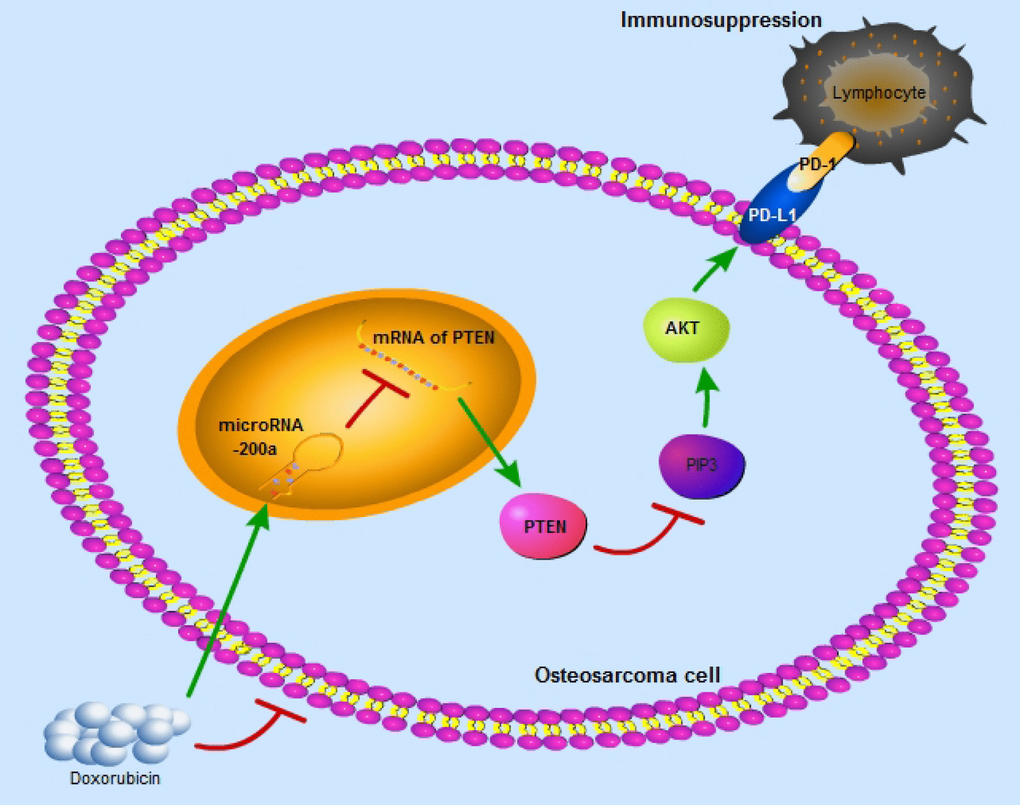
Figure 8.
The schematic graph reflects miR-200a/PTEN/PD-L1 axis in the osteosarcoma cells to induce immunosuppression.