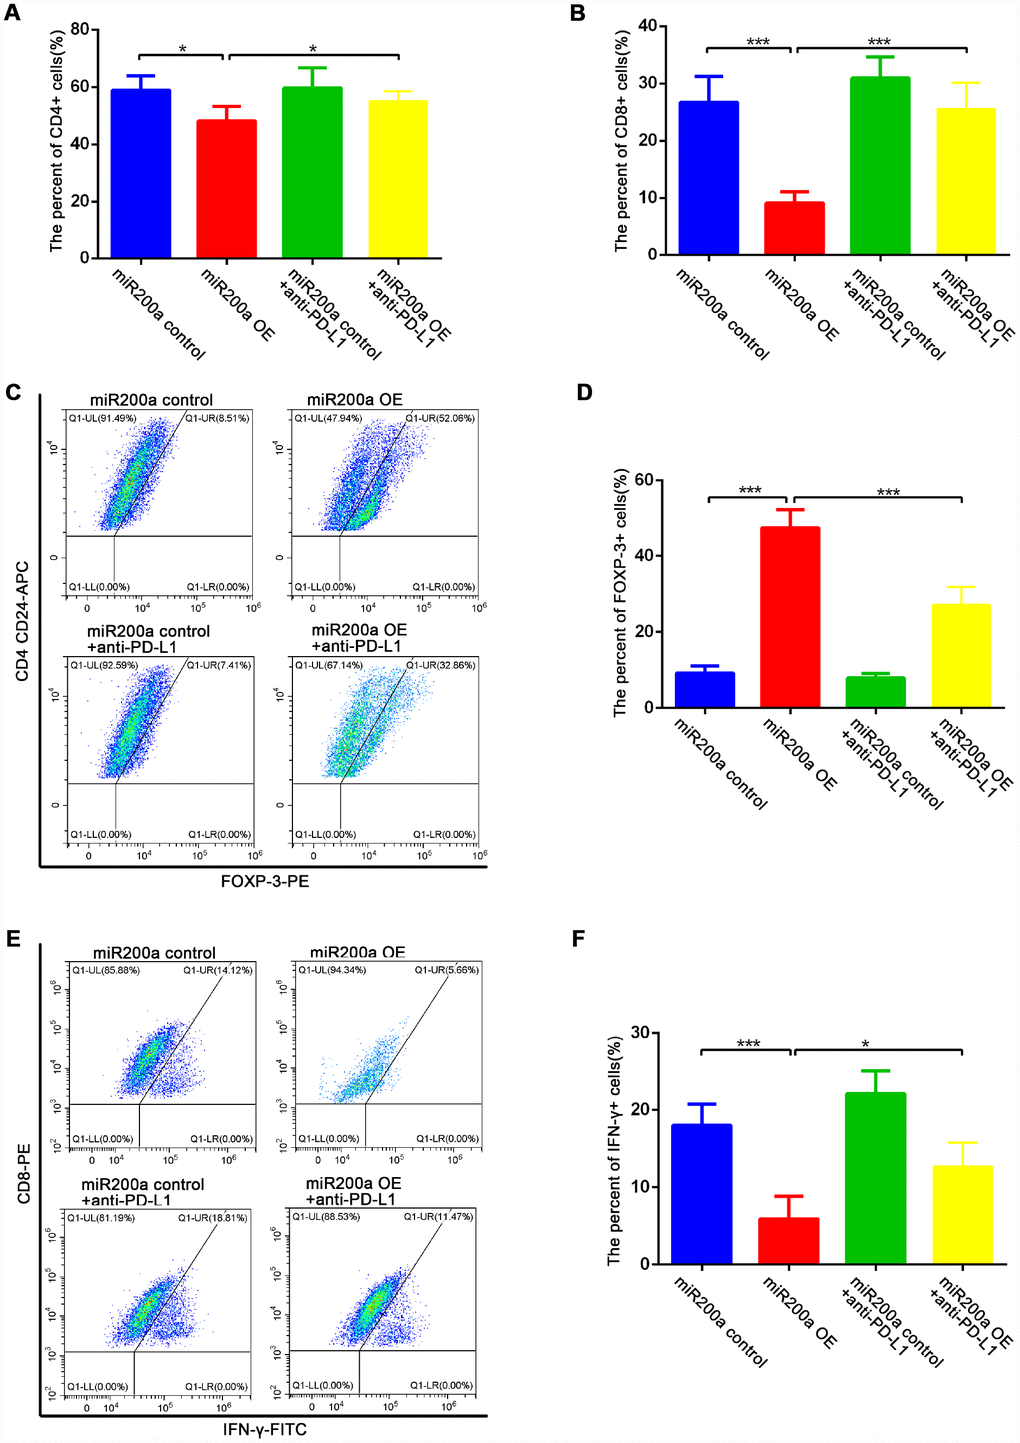
Figure 5.miR-200a impaired anti-tumor immunity in vivo. (A–B) Flow cytometry analysis of intratumoral proportion of CD4+ and CD8+ T cells. (C–D) Flow cytometry analysis of intratumoral proportion of Foxp3+ Treg cells. (E–F) Flow cytometry analysis of intratumoral proportion of IFN-γ+ CTLs. *P<0.05, **P<0.01, ***P<0.001.