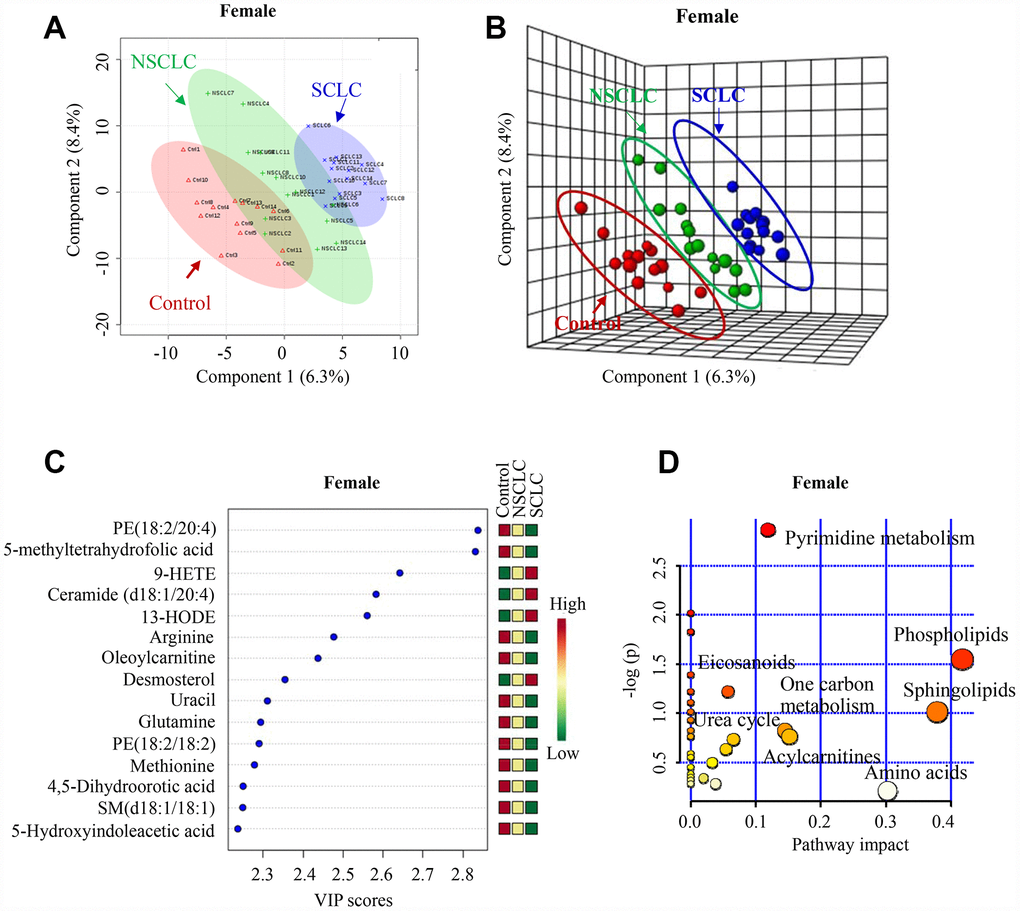
Figure 3.The unique metabolic features in the DBS of female SCLC patients compared to NSCLC and noncancer controls. (A, B) Multivariate analysis of metabolomic data using PLS-DA resulted in a clear separation of metabolic features among SCLC, NSCLC and the control group in females. (A) 2-D plot. (B) 3-D plot. (C) The top 15 most differential metabolites in female patients with SCLC revealed by VIP analysis. VIP>1.5 was considered as statistically significant. The VIP results were also verified by univariate ANOVA analysis. (D) The top pathways disturbed in female SCLC patients. Abbreviations: DBS = dried blood spot; NSCLC = non-small cell lung cancer; PE = phosphatidylethanolamine; 9-HETE = 9-hydroxyeicosatetraenoic acid; 13-HODE = 13-Hydroxyoctadecadienoic acid; SM = Sphingomyelin; PLS-DA = partial least square discriminant analysis; SCLC = small cell lung cancer; VIP = variance in projection.