Submit an Article
Navigate
Home
Editorial Board
Editorial Policies
Current Volume
Archive
Scientific Integrity
Publication Ethics Statements
Interviews with Outstanding Authors
Newsroom
Sponsored Conferences
Podcast
Contact
Special Collections
Submit an Article
Online ISSN: 1945-4589
Research Paper
|
Volume 12, Issue 2
|
pp. 1047–1086
CeRNA regulatory network-based analysis to study the roles of noncoding RNAs in the pathogenesis of intrahepatic cholangiocellular carcinoma
Back to article
Figure 12
(12 of 15)
−
100%
+
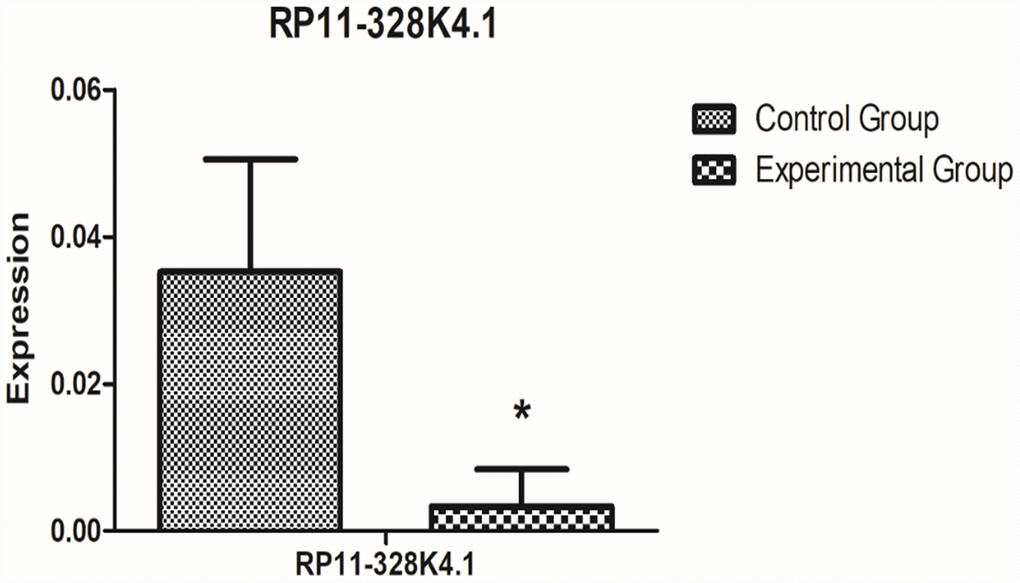
Figure 12.
qRT-PCR analysis showed the difference in lncRNA RP11-328K4.1 expression between the experimental group and control group in ICC fresh tissue samples after normalization to internal controls.
RP11-328K4.1 was normalized to β-actin.