Submit an Article
Navigate
Home
Editorial Board
Editorial Policies
Current Volume
Archive
Scientific Integrity
Publication Ethics Statements
Interviews with Outstanding Authors
Newsroom
Sponsored Conferences
Podcast
Contact
Special Collections
Submit an Article
Online ISSN: 1945-4589
Research Paper
|
Volume 12, Issue 1
|
pp. 387–396
Osteocalcin improves outcome after acute ischemic stroke
Back to article
Figure 3
(3 of 6)
−
100%
+
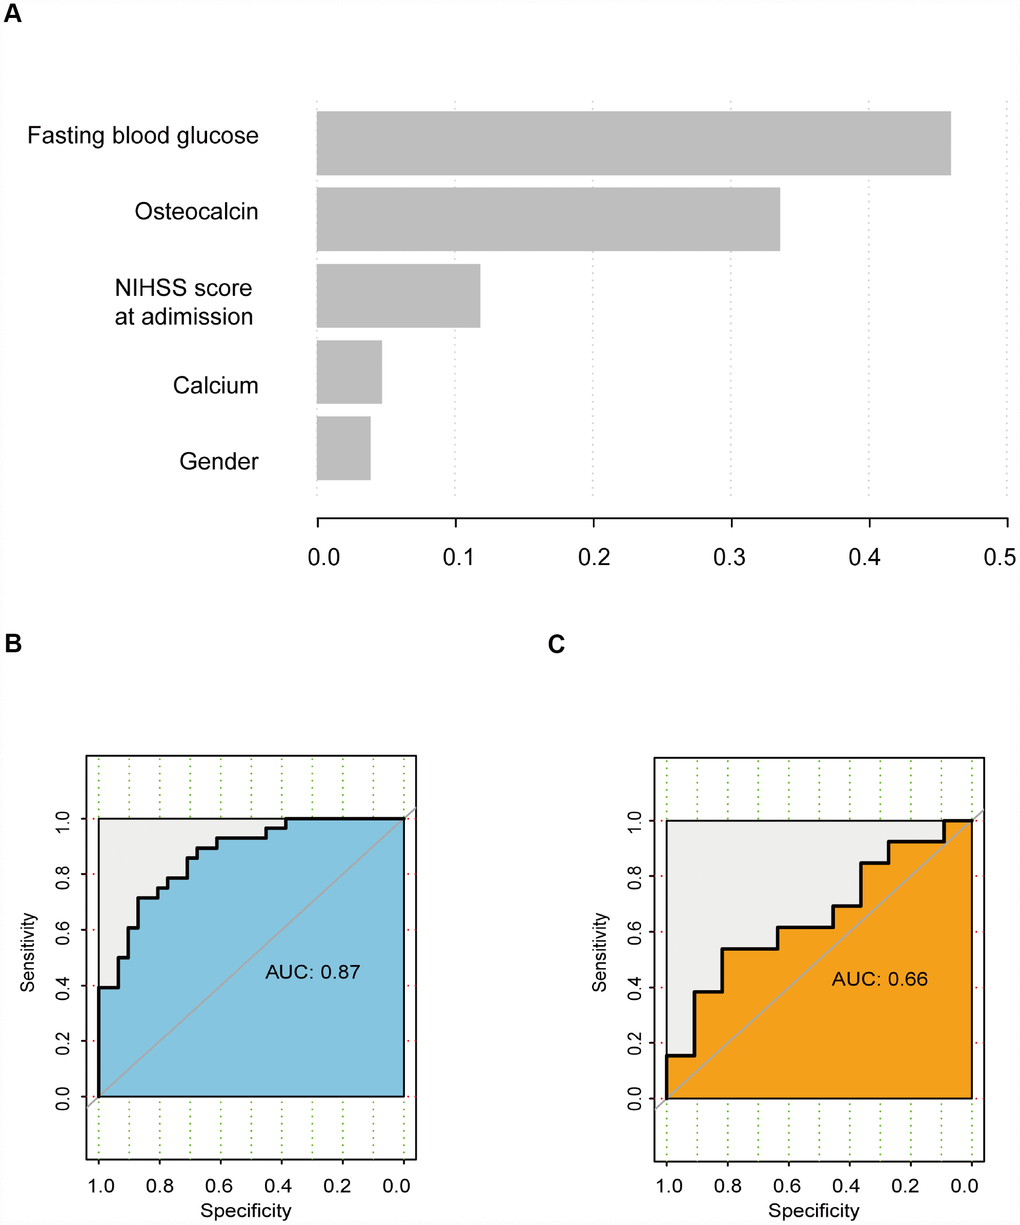
Figure 3.
GBDT analysis.
(
A
) Rank of variables according to their importance. (
B
) ROC curve of the training cohort. (
C
) ROC curve of the validation cohort.