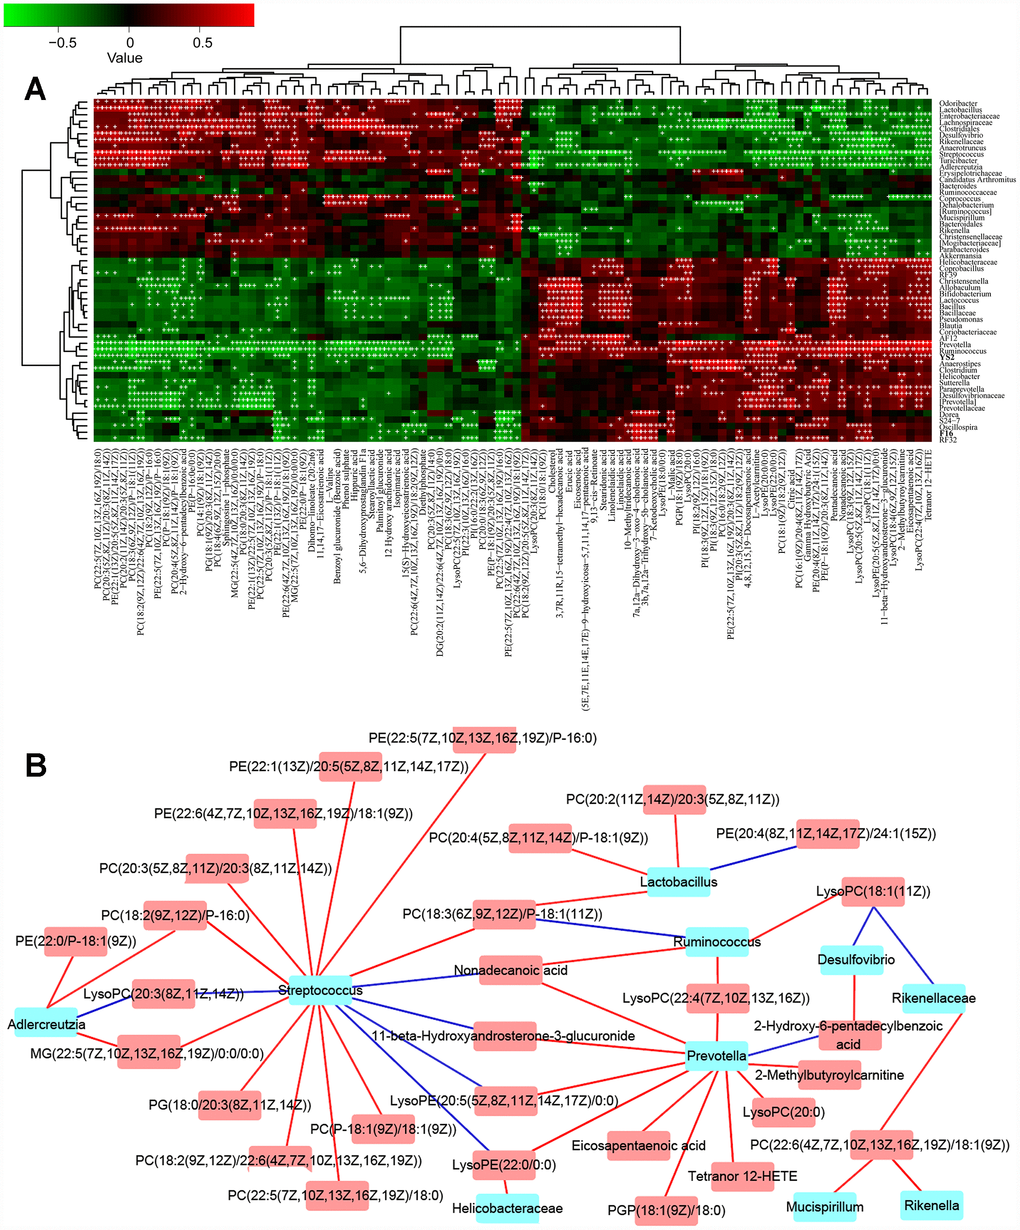
Figure 1.The combined data analysis between gut microbiome and serum metabolome of APP/PS1 mice. (A) The Spearman correlation coefficient for each metabolite type and each bacterial genus, see also Supplementary Figure 1A–1B and Supplementary Figure 2A–2B. (B) Serum metabolome and genera. Red and blue indicate positive and negative correlations, see also Supplementary Figure 1A–1B and Supplementary Figure 2A–2B. Hub nodes with the most connections are highlighted in red. Data are presented as the means of more than 6 independent experiments.
Figure 1 — CircNF1-419 improves the gut microbiome structure and function in AD-like mice | Aging