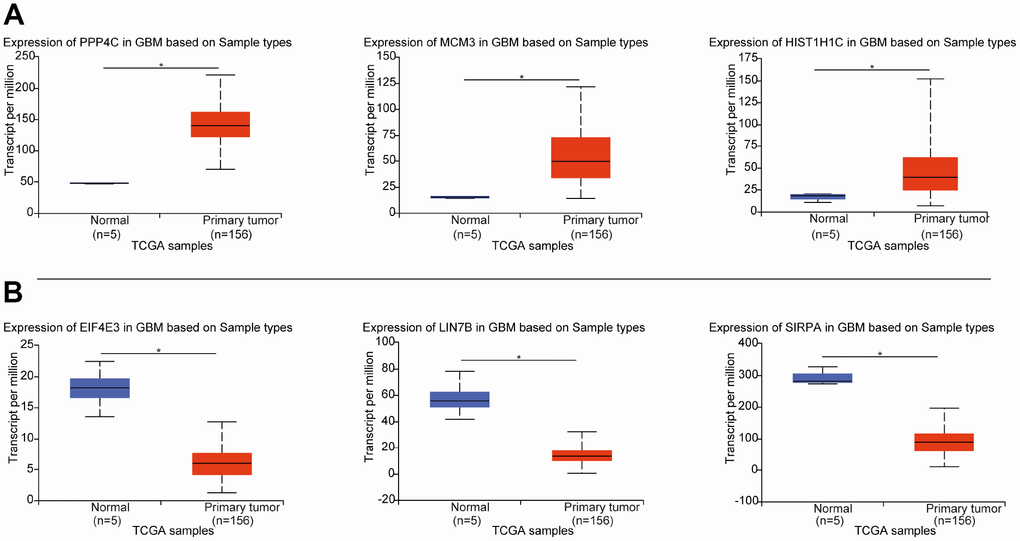
Figure 2.The expression of DEGs in the three datasets from this study in the TCGA dataset. (A) Expression of the top 3 upregulated DEGs from TCGA GBM. (B) Expression of the top 3 downregulated DEGs from TCGA GBM. *p < 0.05 indicates a significant difference.