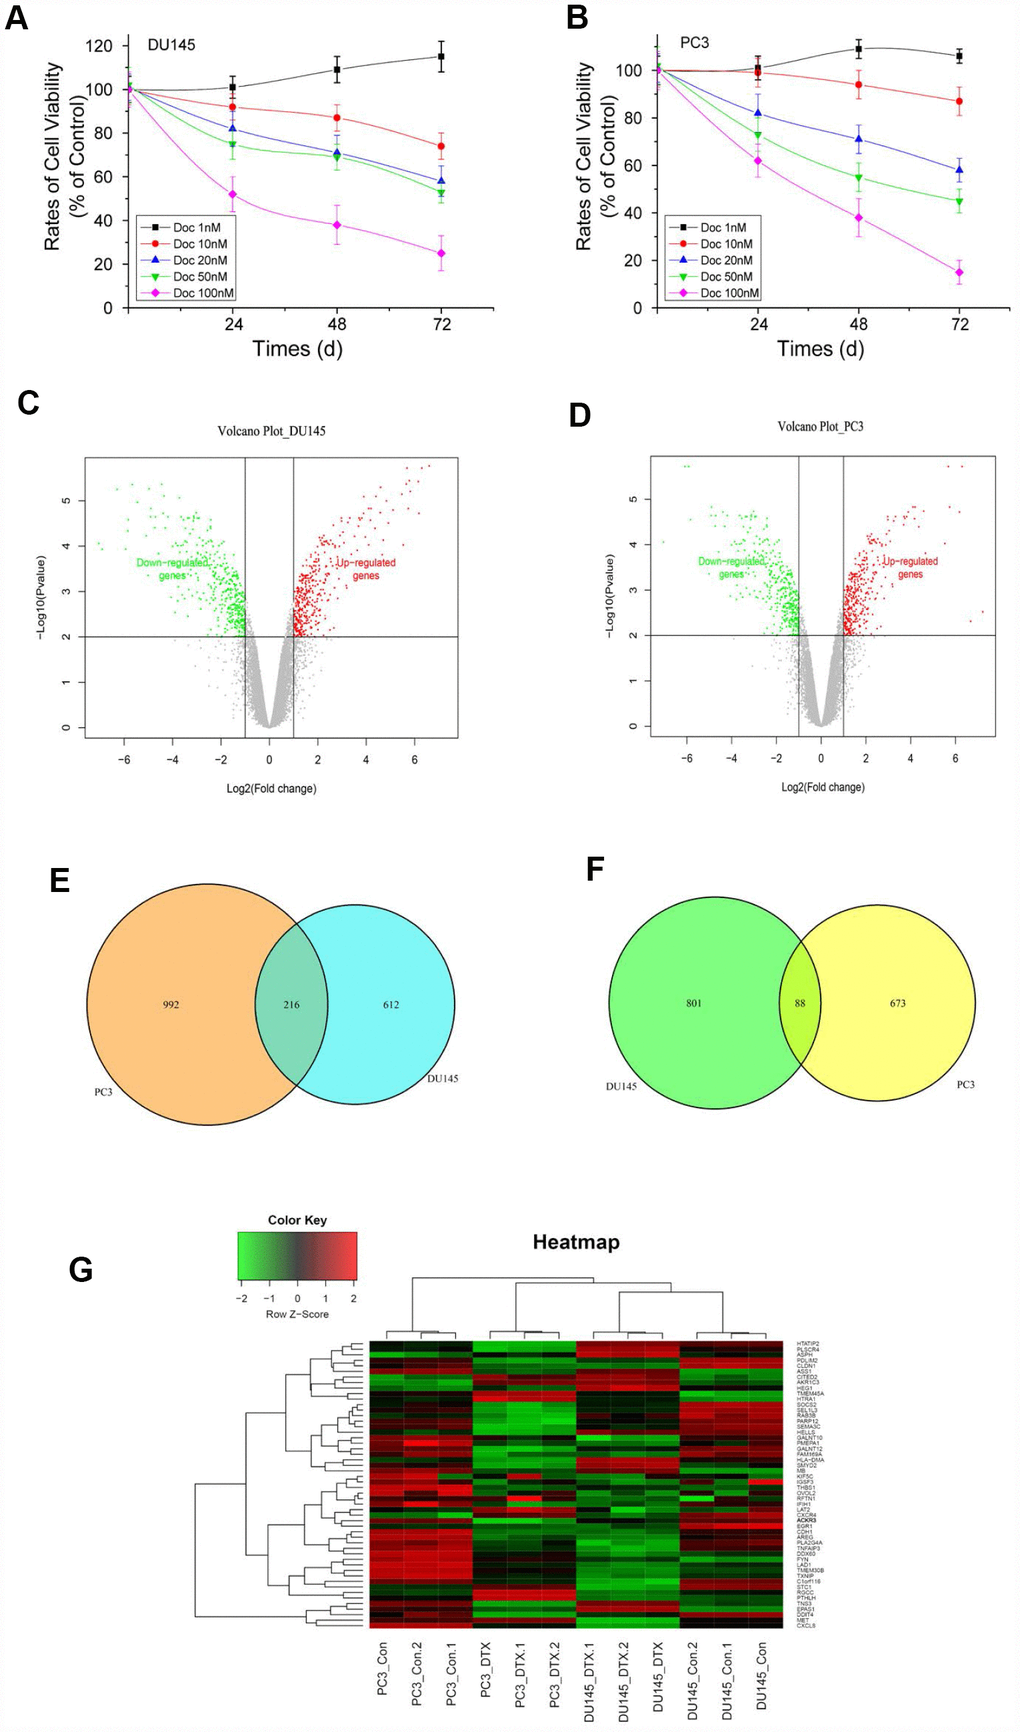
Figure 1.Cell viability of PCa cells treated with different concentrations of Doc, volcano plots and Venn diagrams of DEGs. (A) DU145 cells treated with different concentrations of Doc; (B) PC3 cells treated with different concentrations of Doc. Viability of DU145 and PC3 cells was determined by MTT assay. Error bars = SEM (n = 6). (C and D) Volcano plots of DEGs from DU145R and PC3R compared with their parent cell lines respectively. X-axes show the fold changes (log-scaled), and Y-axes indicate p values (log-scaled). Red and green dots represent upregulated and downregulated genes, respectively. Grey dots represent non-DEGs. (E and F) VennPlots for the downregulated and upregulated DEGs. (G) Heatmap of DEGs overlapping between the DU145R and PC3R datasets. Red represents higher expression and green lower expression. The criteria used to select DEGs were P<0.05 and |log2 (fold-change)|>1. DEGs, differentially expressed genes.