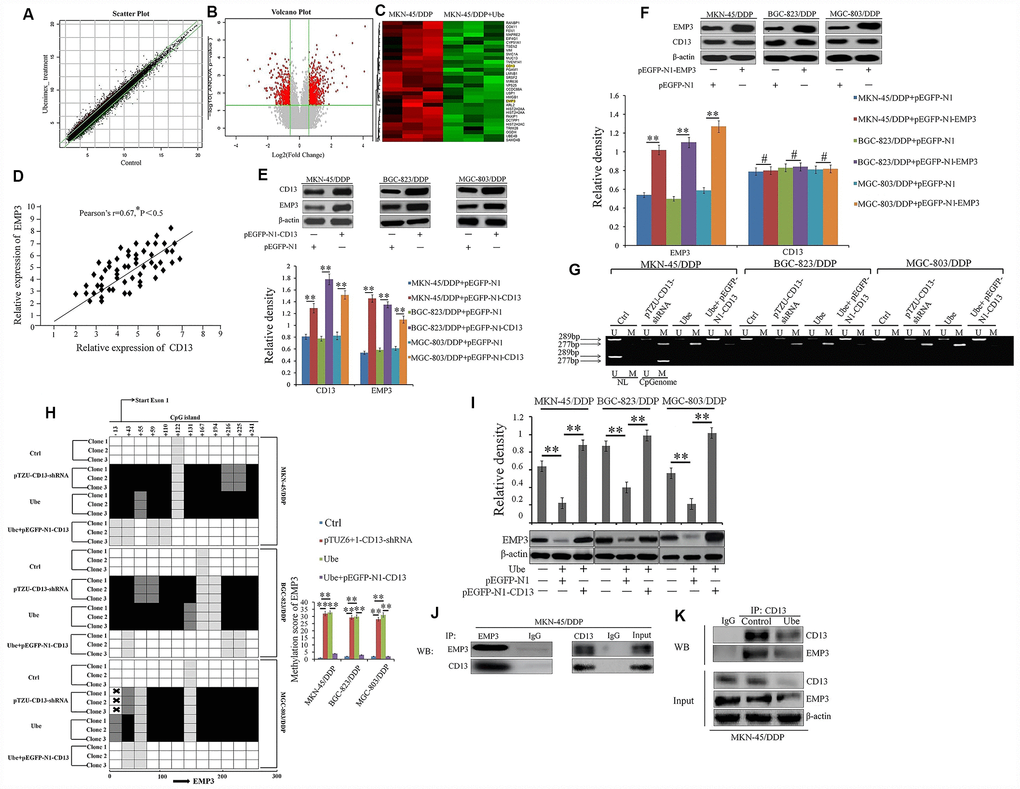
Figure 5.EMP3 is a potential downstream target of CD13 in Ubenimex-treated CDDP-resistant GC cells. (A) The scatter plot image showing the distribution of signal intensity in a rectangular coordinate plane. Red and green dots outside the interval represented the up-regulated probes in the Ubenimex-treated and control cells, respectively. (B) The volcano plot image for all of the genes. Gray and Red puncta represented equally (Fold Change<1.5) and differentially expressed mRNAs (Fold Change ≥1.5) between Ubenimex-treated MKN-45/DDP and MKN-45/DDP cells. (C) Heat map was generated using R package to depict 1306 transcripts that were significantly differentially expressed in MKN-45/DDP cells after Ubenimex treatment (Fold Change≥1.5 and *P<0.05). The green and red colors indicate up-regulated and down-regulated transcripts, respectively. (D) The correlation between EMP3 and CD13 expression in GC patients with CDDP treatment was supervised by Pearson correlation analysis. (E) EMP3 expression was identified by Western blot assay in CDDP-resistant GC cells after CD13 was over-expressed. (F) CD13 expression was also determined by Western blot assay in CDDP-resistant GC cells after EMP3 was over-expressed. (G) Methylation-specific PCR for EMP3 in CDDP-resistant GC cells. Bands M and U represented methylated and unmethylated EMP3, respectively (H) The methylation status of EMP3 CpG island promoter was clarified in CDDP-resistant GC cells with indicated treatment. The results are represented as bisulfite genomic sequencing of 3 individual clones in a 4-tiered semi-quantitative grey-scale pattern (left panels): white square, represented not methylated, and methylation score was “0”; light gray, represented weakly methylated and methylation score was “1”; gray represented moderately methylated and methylation score was “2”; black represented strongly methylated and methylation score was “3”. Means±SD of methylation score (right panel) from three independent experiments were also shown. **P<0.01. (I) CDDP-resistant GC cells were pre-transfected with pEGFP-N1-CD13 or NC plasmids for 24 h, and then stimulated with Ubenimex (0.2mg/mL) for another 24 h. EMP3 expression were detected by Western blot assay. (J, K) Direct interaction between endogenous CD13 and EMP3 in MKN-45/DDP (J) and Ubenimex-treated MKN-45/DDP cells (K) were determined by co-IP assays using anti-CD13 or anti-EMP3. For Western blot assay, all of the data were manifested as the representatives and the relative expression with means±SD from three independent experiments. **P < 0.01 and #P>0.05.