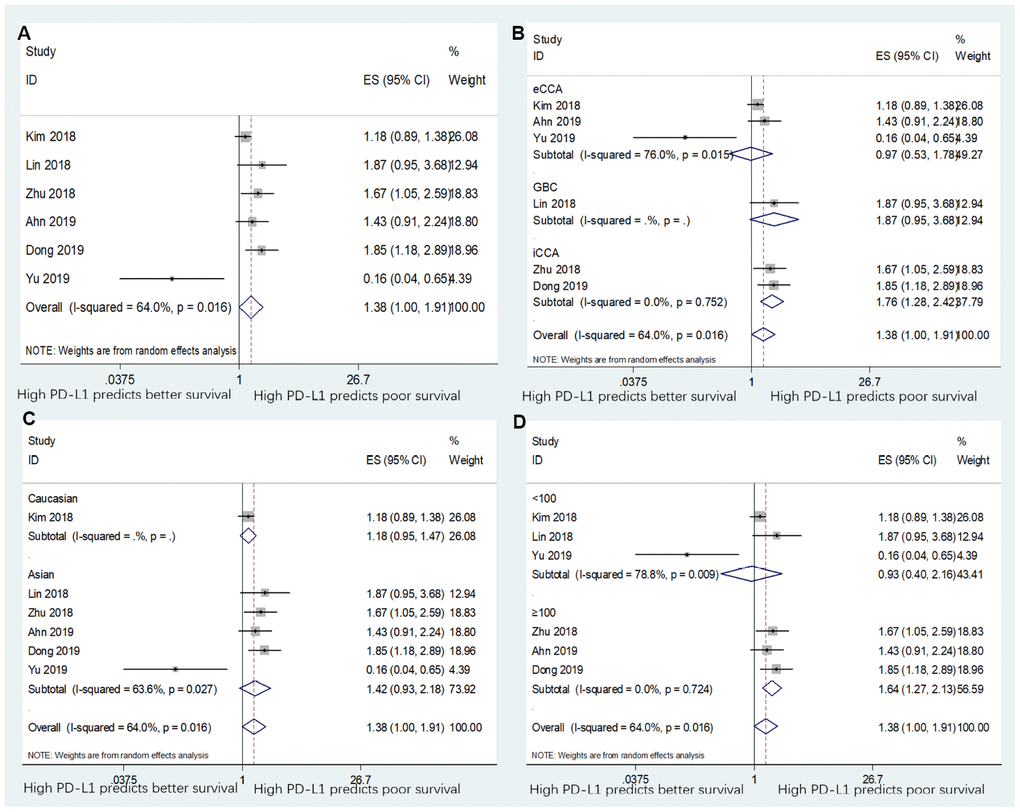
Figure 3.Forest plots for the association between PD-L1 expression and disease-free survival (DFS) categorized by different subgroups: (A) the entire patient group; (B) patients with eCCA, GBC, or iCCA; (C) patients with Asian ethnicity or Caucasian ethnicity; and (D) studies with sample size ≥100 or sample size <100. Note: The right-side means “High PD-L1 predicts poor survival” and the left-side means “High PD-L1 predicts better survival”.