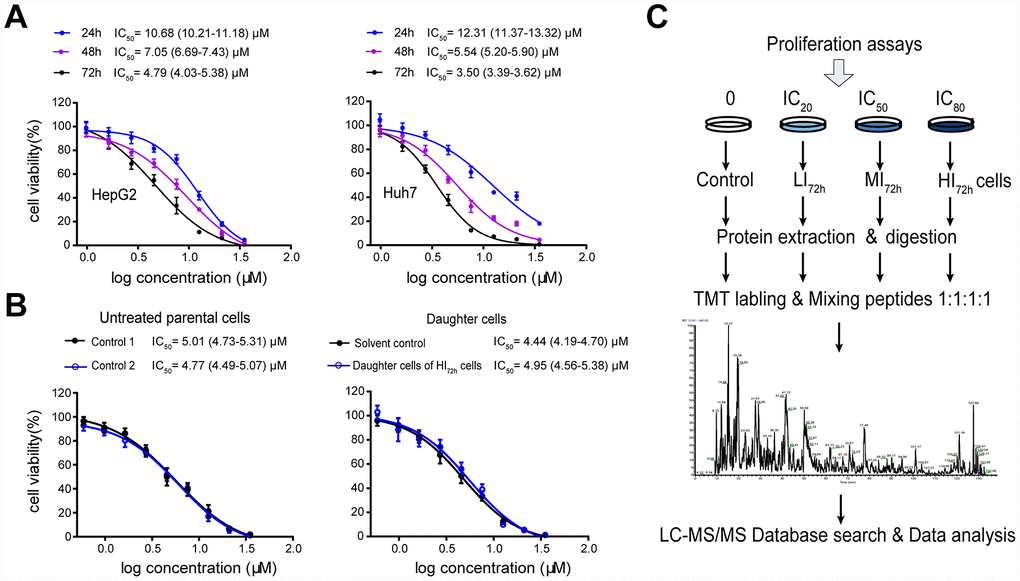
Figure 1.High-insensitive HepG2 cells do not belong to the sorafenib-resistant HepG2 cells. (A) Inhibitory effect of sorafenib treatment (24 h, 48 h and 72 h) on cell viability. The results represent as mean ± SD, n=6 per concentration. (B) Comparison of the IC50 values between untreated parental cells and the daughter cells of HI72h HepG2 cells. Two groups of untreated cells were used as controls for DMSO treatment (solvent control) and IC80 of sorafenib treatment, respectively. The results represent as mean ± SD, n=5 per concentration. Dose response curves were analyzed via nonlinear regression followed by two-way ANOVA for comparisons between 2 curves, p> 0.05. (C) Workflow of TMT-based proteomic experiment. See Methods for experimental details.