Submit an Article
Navigate
Home
Editorial Board
Editorial Policies
Current Volume
Archive
Scientific Integrity
Publication Ethics Statements
Interviews with Outstanding Authors
Newsroom
Sponsored Conferences
Podcast
Contact
Special Collections
Submit an Article
Online ISSN: 1945-4589
Research Paper
|
Volume 11, Issue 24
|
pp. 12428–12451
System level characterization of small molecule drugs and their affected long noncoding RNAs
Back to article
Figure 5
(5 of 6)
−
100%
+
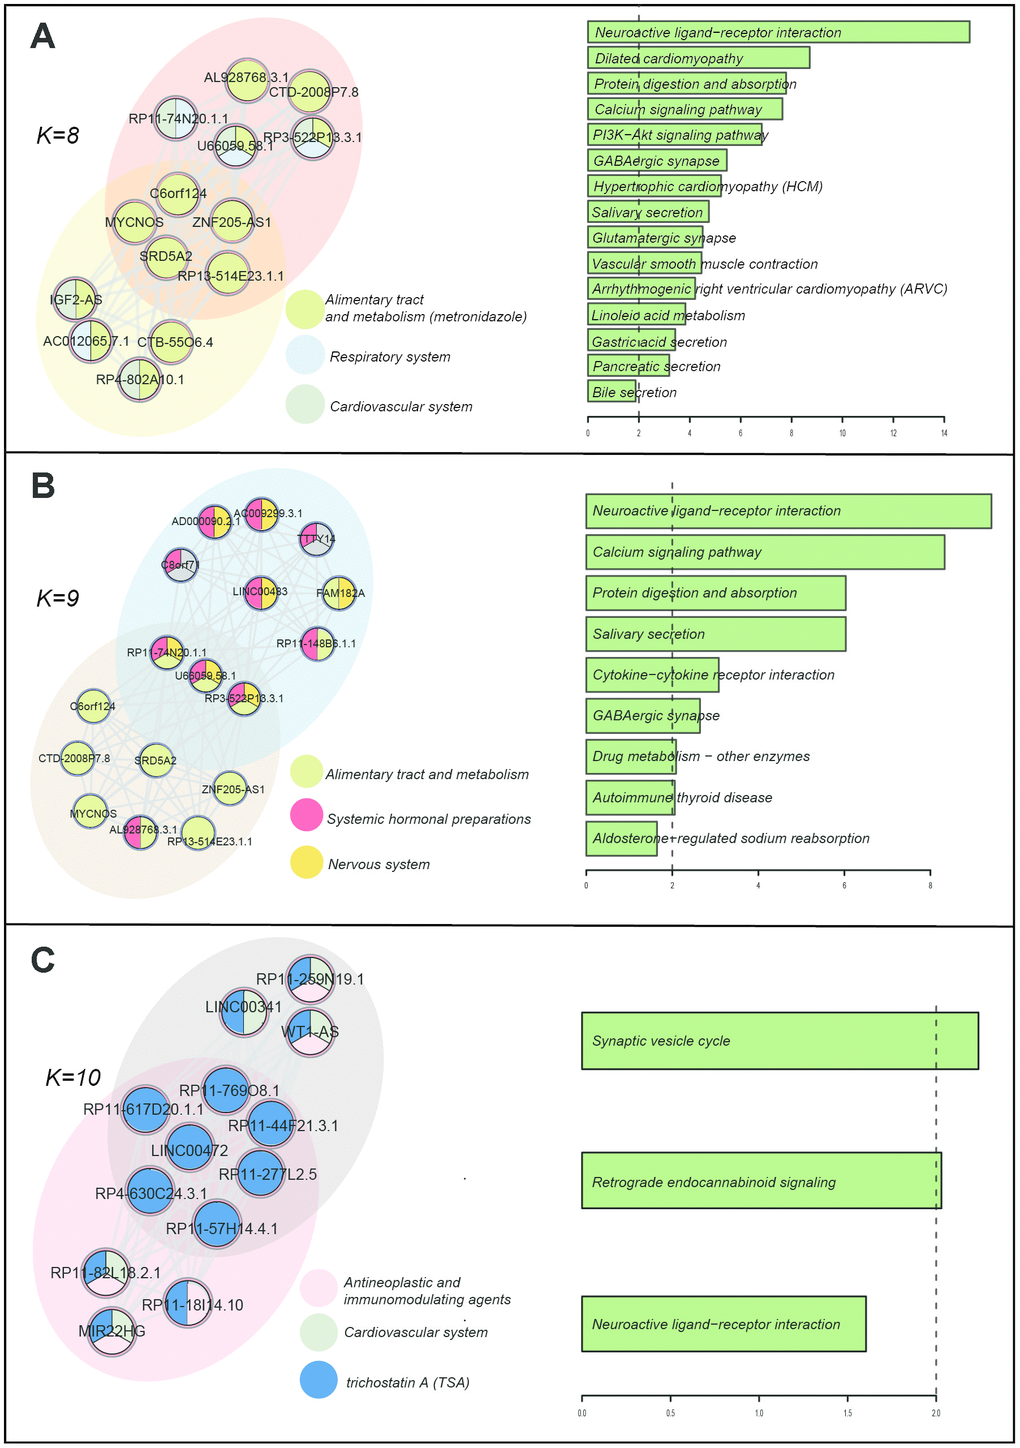
Figure 5.
Drug-induced lncRNA modules and enriched KEGG pathways.
(
A
) k=8. (
B
) k=9. (
C
) k=10. The K represents the number of the nodes in the modules.
Figure 5 — System level characterization of small molecule drugs and their affected long noncoding RNAs | Aging