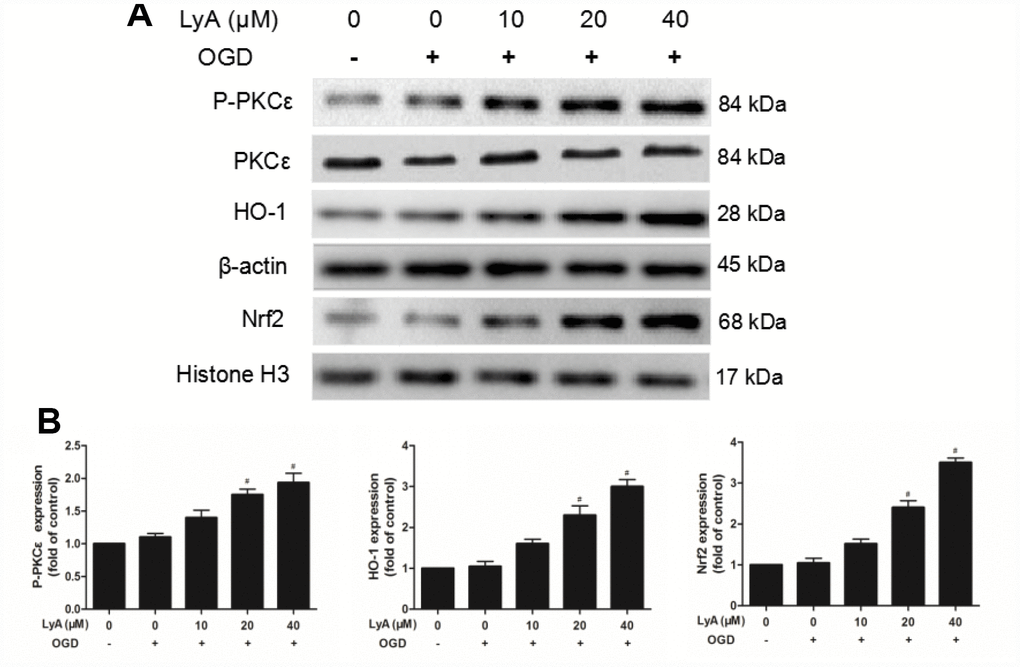
Figure 6.Effect of LyA treatment on PKCε phosphorylation, activation of Nrf2/HO-1 pathway in SH-SY5Y cells. (A) Representative bands of each protein are presented. (B) Relative expressions are calculated and are shown here. Data were represented as means ± SD (n=6). *p < 0.05 compared with control group; #p < 0.05 compared with OGD group.