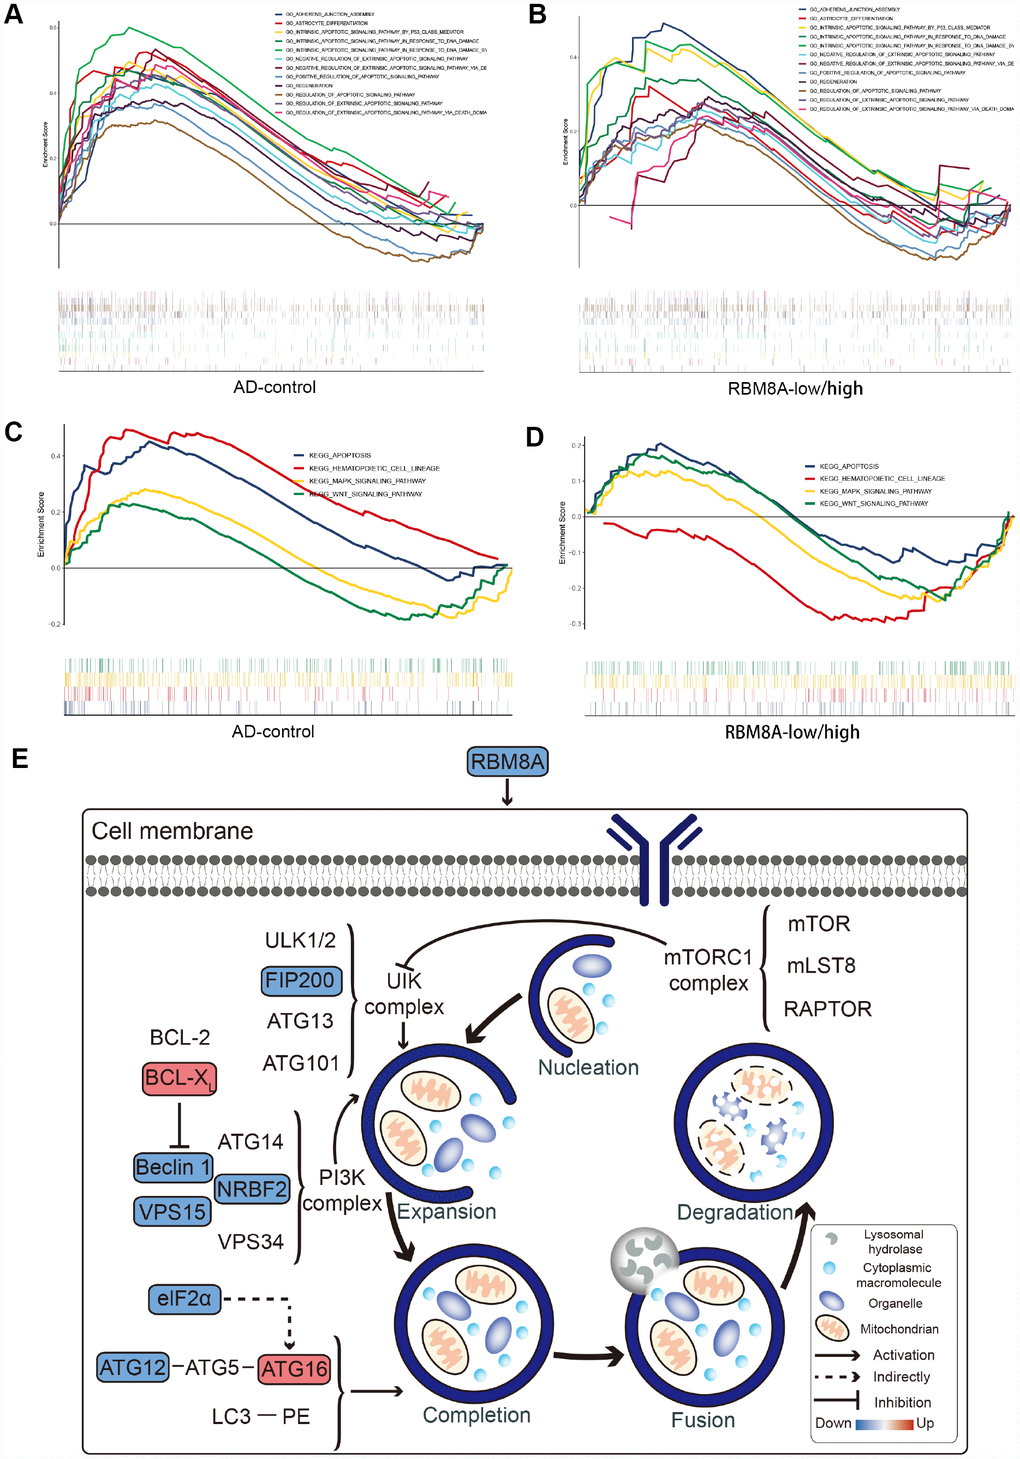
Figure 4.Result of Gene Set Enrichment Analysis. (A) Biological processes enriched in AD. (B) Biological processes enriched in RBM8A-low. (C) KEGG pathways enriched in AD. (D) KEGG pathways enriched in RBM8A-low. (E) Potential mechanism of low expression of RBM8A associated with AD, blue indicates the down-regulated gene and red indicates the up-regulated gene.