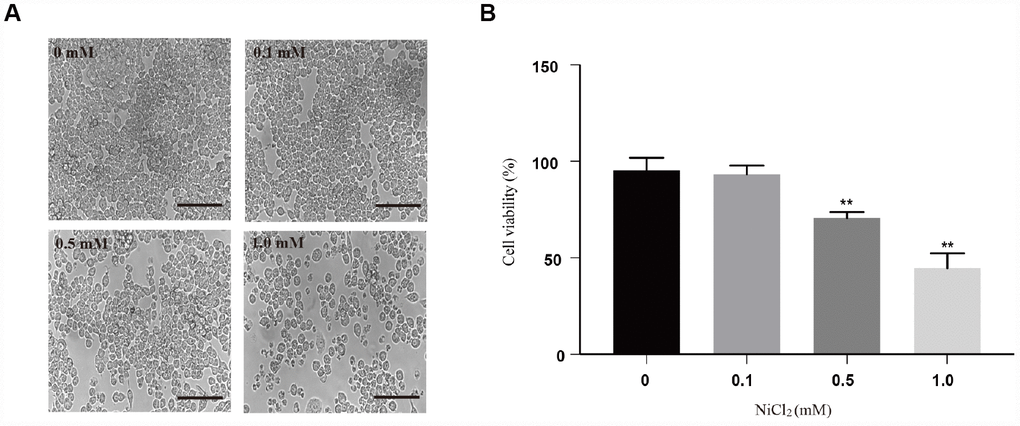
Figure 1.Cytotoxicity of NiCl2 in BMDMs. (A) BMDMs are treated with NiCl2 (0, 0.1, 0.5 and 1.0 mM) for 24h, and changes of cell numbers were observed by microscopy. Scale bar 50 μm. (B) Cell viability is analyzed by MTT assay. Data are presented with the means ± standard deviation (n=5). *p < 0.05 and **p < 0.01, compared with the control group.